


Abstract
Context: Ghrelin is an orexigenic hormone that can increase body weight. Its circulating levels increase before meals and are suppressed after food ingestion. Understanding the effects of specific types of ingested macronutrients on ghrelin regulation could facilitate the design of weight-reducing diets.
Objective: We sought to understand how ingestion of carbohydrates, proteins, or lipids affect acyl (bioactive) and total ghrelin levels among human subjects, hypothesizing that lipids might suppress ghrelin levels less effectively than do either carbohydrates or proteins.
Design: This was a randomized, within-subjects cross-over study.
Setting: The study was conducted at a University Clinical Research Center.
Participants: There were 16 healthy human subjects included in the study.
Interventions: Isocaloric, isovolemic beverages composed primarily of carbohydrates, proteins, or lipids were provided.
Main Outcome Measures: The magnitude of postprandial suppression of total and acyl ghrelin levels (measured with a novel acyl-selective, two-site ELISA) was determined.
Results: All beverages suppressed plasma acyl and total ghrelin levels. A significant effect of macronutrient class on decremental area under the curve for both acyl and total ghrelin was observed; the rank order for magnitude of suppression was protein more than carbohydrate more than lipid. Total ghrelin nadir levels were significantly lower after both carbohydrate and protein, compared with lipid beverages. In the first 3 postprandial hours, the rank order for acyl and total ghrelin suppression was carbohydrate more than protein more than lipid. In the subsequent 3 h, there was a marked rebound above preprandial values of acyl and total ghrelin after carbohydrate ingestion alone.
Conclusions: These findings suggest possible mechanisms contributing to the effects of high-protein/low-carbohydrate diets to promote weight loss, and high-fat diets to promote weight gain.
Dietary interventions remain a cornerstone of obesity treatment, yet most dieters experience difficulty achieving and maintaining weight loss (1). Weight loss triggers compensatory changes in hormones that regulate appetite and energy expenditure, promoting weight regain through the process of energy homeostasis (2). Despite widespread use of various macronutrient-focused diets, a full understanding of how these interventions affect hormonal mediators of energy homeostasis is lacking. One gastrointestinal peptide that bridges the regulation of long-term energy homeostasis and short-term food intake is ghrelin, the only known appetite-stimulating hormone (3). Considerable evidence supports a role for ghrelin in body-weight regulation. Ghrelin is also implicated in short-term mealtime hunger and meal preparation and/or initiation, in part because circulating levels increase before meals and are suppressed by food intake (4). Improving our understanding of the regulation of ghrelin by ingested macronutrients could facilitate the rational design of weight-reducing diets.
Existing studies examining the effects of various dietary macronutrients on human ghrelin levels are conflicting or, in some cases, inconclusive due to inadequate matching of the caloric content and volume of test meals, short monitoring periods, infrequent blood sampling, and/or small variations in macronutrient composition (5–7). To our knowledge, no study has examined the effects of all three macronutrient classes (carbohydrates, lipids, and proteins) on levels of acyl-ghrelin, which is the bioactive form, concurrently with total immunoreactive ghrelin (acyl plus des-acyl), which is the most commonly used ghrelin measurement. Growing evidence suggests that des-acyl ghrelin may exert its own biological effects (8), and in some cases, levels of acyl and des-acyl ghrelin do not respond equivalently to stimuli (9, 10). We sought to understand how ingestion of different macronutrient classes affects acyl and total ghrelin levels by collecting frequent blood samples from humans over an extended time period after meal ingestion. Each meal was composed of primarily carbohydrates, lipids, or proteins, with equal total caloric content, volume, and energy density. Based on our rodent experiments (11) and the clinical association of high-fat diets with weight gain (12, 13), we hypothesized that lipids might suppress ghrelin less effectively than isocaloric consumption of either carbohydrates or proteins.
Subjects and Methods
Study participants
Participants were recruited from the Seattle area and were invited to the General Clinical Research Center for a screening assessment if they were healthy, nondieters, nonpregnant, had a body mass index (BMI) less than 30 kg/m2, and had no food allergies. After obtaining medical and nutritional histories, we excluded individuals with chronic illness, prior gastrointestinal surgery, or use of illicit drugs, alcohol (more than one serving per day), or tobacco. Individuals were required to be weight stable (within ± 2 kg) for the preceding 6 months, and to be within 2.5 kg of their lifetime maximum weight. Participants provided written informed consent. The University of Washington Human Subjects institutional review board approved the research protocol and procedures.
Study design
Participants came to the General Clinical Research Center for three study sessions, each separated by one or more week (Fig. 1). Before admission, participants fasted for 12 h and refrained from exercise for 24 h. After admission, an iv forearm catheter was placed, and three baseline blood samples were collected at 5-min intervals, beginning at 0850 h. Participants consumed the test beverage between 0900 and 0915 h. Blood samples were obtained every 20 min for 6 h thereafter. Specimens were drawn into tubes on ice and processed at the end of the study unless designated for acyl-ghrelin measurement. Acyl-ghrelin samples were placed in chilled tubes containing final concentrations of 1.8 mg/ml EDTA and 4 mm 4-(2-aminoethyl)-benzene sulfonylfluoride. These samples were centrifuged every 2 h, and separated plasma was immediately acidified with 500 mm sodium citrate (final concentration 20 mm). All samples were stored at −80 C.
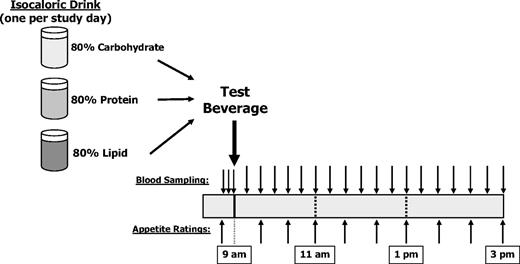
Diagram of study design.
Participants rated their hunger and fullness levels using visual analog scales (VASs), starting 20 min before beverage consumption and continuing every 40 min thereafter. The VAS quantified participants’ responses to standard questions addressing hunger, fullness, desire to eat, prospective food consumption, and nausea. For each question, participants placed a mark on a scale between anchoring terms of “not at all” and “extremely,” and marks were converted to a 0- to 100-point score.
Macronutrient beverage composition
Participants served as their own controls for the consumption of three beverages with widely varying macronutrient composition, provided in random order. Although taste and appearance differed, the drinks were provided blindly in opaque, covered cups. We calculated individual basal energy expenditure using the Harris-Benedict equation, then multiplied this value by an activity factor (1.5 for women, 1.6 for men) to estimate total daily energy expenditure (TEE) (14). The caloric content of each beverage was 20% of TEE, an amount that we have previously shown causes suppression and return to baseline of ghrelin levels within 6 h in humans (15). Of the calories in each beverage, 80% were derived from the macronutrient class of interest, with 10% drawn from each of the other two classes (Table 1). The carbohydrate beverage was composed primarily of glucose, the protein beverage of whey and egg white, and the lipid beverage of whipping cream. For each participant, the total caloric content, volume, and energy density of all beverages remained constant. Thus, test meals differed only in macronutrient distribution.
Beverage composition for a subject with a calculated TEE of 2500 kcal/d (20% TEE = 500 kcal)
| Ingredients | Primary component of beverage | ||
|---|---|---|---|
| Carbohydrate | Protein | Lipid | |
| Total calories (kcal) | 500 | 500 | 500 |
| Volume (ml) | 500 | 500 | 500 |
| Energy density (kcal/g) | 1.0 | 1.0 | 1.0 |
| Carbohydrate (% of calories) | 80 | 10 | 10 |
| Protein (% of calories) | 10 | 80 | 10 |
| Lipid (% of calories) | 10 | 10 | 80 |
| Weight of ingredients (g) | |||
| Fisherbrand SUN-DEX Glucose beverage (Thermo Fisher Scientific Inc., Waltham, MA) | 240.0 | ||
| Whey protein | 75.0 | ||
| Heavy whipping cream | 104.0 | ||
| Water | 220.0 | 171.9 | 357.2 |
| Nonfat milk | 142.0 | ||
| Nonfat dry milk | 35.0 | 6.0 | 7.5 |
| Canola oil | 5.0 | 5.1 | 6.5 |
| Egg white powder | 31.0 | 9.8 | |
| Sugar-free syrups | 70.0 | 15.0 | |
Hormone, glucose, and triglyceride assays
Plasma levels of full-length, acyl-ghrelin were measured using a novel, sensitive and specific, high-throughput sandwich ELISA that we have developed (41). The assay recognizes acyl-ghrelin and does not detect des-acyl ghrelin or peptide fragments. The lower limit of detection was 6.7 pg/ml, and the upper limit was 1000 pg/ml. Intrassay and interassay coefficients of variation (CVs) were 5.5 and 16.0%, respectively. Plasma total immunoreactive ghrelin was measured by RIA (LINCO Research, Inc., St. Charles, MO). Lower and upper limits of detection were 40 and 2560 pg/ml, respectively; intraassay and interassay CVs were 4 and 14.7%, respectively. Insulin was determined using a double-antibody RIA (16), with lower/upper limits of 2.2/300 μU/ml, and intraassay/interassay CVs of 6/10.0%. Plasma leptin was measured by RIA (LINCO Research), with lower/upper detection limits of 0.5/100 ng/ml, and intraassay/interassay CVs of 3.7/5.2%. Plasma glucose was determined with hexokinase, and triglycerides by a colorimetric assay (Hitachi 917; Roche Diagnostics, Indianapolis, IN). All samples were run in duplicate, and all specimens from a given participant were run in the same assay.
Statistical analyses
Data were analyzed using STATA 9.0 software (StataCorp LP, College Station, TX). Participant characteristics, and hormonal and nutrient data are expressed as mean ± sd, unless otherwise stated. We defined baseline levels for all plasma measures as the mean of the three values obtained immediately before beverage consumption, whereas peak or nadir levels were defined as the highest or lowest points achieved during the 6-h post-ingestion period. To facilitate comparisons, ghrelin levels were expressed in percentage of baseline values. Based on these normalized values, the following three parameters were calculated for acyl and total ghrelin. First, ghrelin nadir (GN) was the lowest ghrelin level measured after beverage consumption. Second, the time required to reach the GN was the time to ghrelin nadir (TGN). Finally, the decremental area under the ghrelin curve (D-AUC) was calculated to quantify overall ghrelin response to test beverages, reflecting both depth and duration of suppression. The D-AUC represents the area enclosed by the pre-ingestion baseline and the post-ingestion ghrelin curve until the return to baseline, determined using the trapezoidal rule. We tested the effects of time and macronutrient type on acyl and total ghrelin using repeated-measures ANOVA (RM-ANOVA). When significant for the main effect (P ≤ 0.05), differences among three macronutrient pairs were examined using Bonferroni-adjusted t tests (P ≤ 0.017).
Two additional ghrelin parameters were defined post hoc after we observed distinct patterns in early vs. later periods for both the acyl and total ghrelin. We divided the 6-h study into two equal intervals to calculate a 0- to 3-h D-AUC and a 3- to 6-h D-AUC (D-AUC0–3 and D-AUC3–6, respectively). We analyzed the effect of macronutrient type on D-AUC0–3 or D-AUC3–6 using RM-ANOVA, followed by Bonferroni-adjusted paired t tests. We also examined whether D-AUC0–3 and D-AUC3–6 behaved differently within each macronutrient class. Pearson’s correlation coefficients were used to explore associations between ghrelin parameters and other hormonal and nutrient determinants. We investigated whether participants’ VAS appetite ratings differed among macronutrients using RM-ANOVA with post hoc paired, Bonferroni-adjusted t tests as appropriate.
Results
All three study visits were completed by seven men and nine women (25% non-Caucasian), ages 20–65 yr (34 ± 14), with a BMI range of 19.7–29.1 kg/m2 (24.1 ± 2.7). Fasting baseline hormone and nutrient measures were equivalent across all three study visits (Table 2).
Participant characteristics and fasting hormone, glucose, and triglyceride levels across three study visits
| Baseline assessment | Carbohydrate visit | Protein visit | Lipid visit | |
|---|---|---|---|---|
| Age (yr) | 34 ± 14 | |||
| Height (cm) | 170.5 ± 8.4 | |||
| Weight (kg) | 70.1 ± 8.8 | 70.3 ± 8.9 | 70.5 ± 9.1 | 70.4 ± 8.7 |
| BMI (kg/m2) | 24.1 ± 2.7 | 24.2 ± 2.7 | 24.3 ± 2.8 | 24.2 ± 2.7 |
| Calories in test beverages (=20% of TEE) | 478 ± 70 | 478 ± 70 | 478 ± 70 | |
| Acyl ghrelin (pg/ml) | 98 ± 75 | 102 ± 74 | 101 ± 87 | |
| Total ghrelin (pg/ml) | 786 ± 246 | 768 ± 290 | 756 ± 266 | |
| Insulin (μU/ml) | 14 ± 5 | 14 ± 5 | 16 ± 5 | |
| Leptin (ng/ml) | 10 ± 8 | 9 ± 8 | 10 ± 9 | |
| Glucose (mg/dl) | 88 ± 7 | 89 ± 9 | 92 ± 6 | |
| Triglycerides (mg/dl) | 77 ± 35 | 86 ± 47 | 76 ± 33 |
Data are expressed as mean ± sd. P > 0.05 for all between-visit comparisons.
Plasma metabolites, insulin, and leptin
The three test beverages exerted the effects anticipated from their macronutrient distribution on glucose, insulin, and triglyceride levels. Plasma glucose levels increased by 60% (from 88±7 to 140±31 mg/dl) by 40 min after the carbohydrate beverage, normalizing by 180 min, whereas no glucose elevation occurred after protein or lipid beverages (Fig. 2A). Insulin levels peaked at 40 min after each of the drinks (Fig. 2B). As expected, the greatest insulin increase occurred after carbohydrate consumption, in which levels increased by 764% (from 14±5 to 107±33 uU/ml). The peak after protein consumption was the next largest (391% increase), and lipids induced the smallest increase (183% increase). The effect of protein to increase plasma insulin was sustained until the end of sampling at 6 h, whereas it reached baseline at 240 min after lipids and 260 min after carbohydrates. The lipid beverage predictably exerted the greatest effect on plasma triglyceride levels (Fig. 2C), which increased by 78% (from 76±33 to 128±65 mg/dl), remaining elevated throughout the study. Protein ingestion caused a steady increase in triglyceride levels to 27% above baseline, whereas carbohydrate ingestion caused a 12% decrease, followed by a 12% increase relative to baseline. Leptin levels changed relatively little after each test ingestion (Fig. 2D). Carbohydrate ingestion yielded no change from baseline, whereas protein and lipid ingestions caused 13 and 18% decreases, respectively.
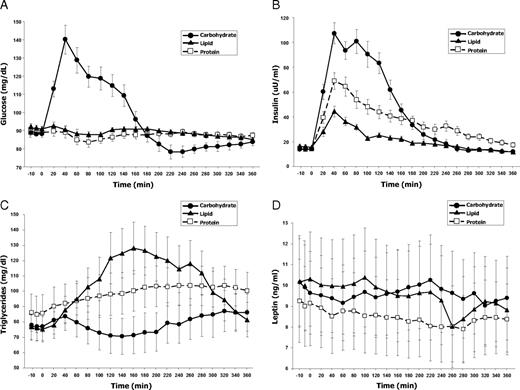
Effects of three types of macronutrient ingestion on plasma levels of glucose (A), insulin (B), triglycerides (C), and leptin (D). All test beverages were equivalent in terms of their volume, total caloric content, and energy density. They differed only in macronutrient distribution. Baseline values of each analyte were equivalent across all three study visits (see also Table 2). Results are expressed as means ± sem.
Acyl-ghrelin levels: nadir, time to nadir, and D-AUC
Three subjects’ acyl-ghrelin levels could not be measured because their samples were not available; therefore, for all acyl-ghrelin analyses, n = 13. Fasting baseline plasma acyl-ghrelin levels were equivalent at all three study visits (carbohydrate visit 98 ± 75 pg/ml, protein visit 102 ± 74 pg/ml, and lipid visit 101 ± 87 pg/ml; all comparisons P > 0.5; Table 2). Relative to the respective baselines, acyl-ghrelin levels decreased significantly after each test beverage ingestion (carbohydrate nadir 34 ± 25 pg/ml, protein nadir 38 ± 32 pg/ml, and lipid nadir 38 ± 28 pg/ml; all P < 0.001 vs. respective baseline values; Fig. 3A).
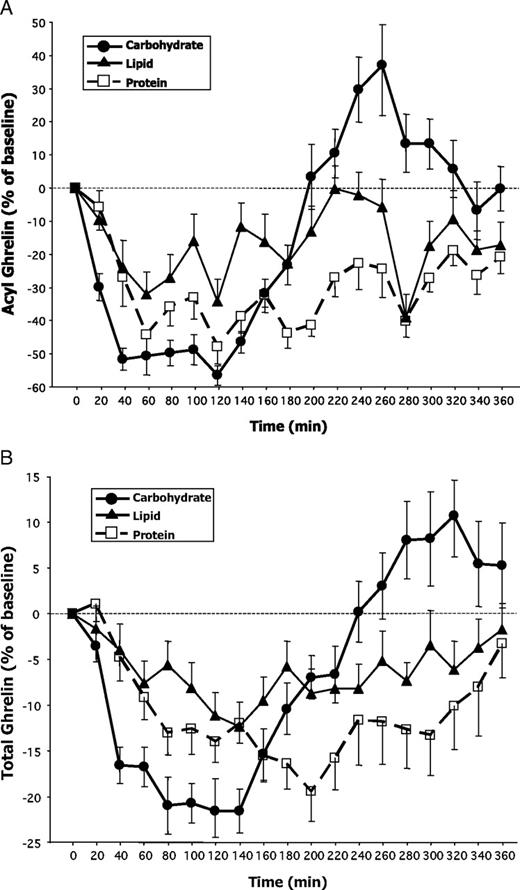
Effects of three types of macronutrient ingestion on plasma acyl-ghrelin (A) and total ghrelin (B) levels expressed as a percentage of their respective baseline values. The baseline value was defined as the mean of three samples obtained at −10, −5, and 0 min (just prior to test beverage ingestions). All test beverages were equivalent in terms of their volume, total caloric content, and energy density. They differed only in macronutrient distribution. Baseline values of acyl- and total ghrelin were equivalent across all three study visits (see also Table 2). Results are expressed as means ± sem.
We compared the relative efficacy of different macronutrients to suppress acyl-ghrelin levels using GN, TGN, and D-AUC to characterize thoroughly the ghrelin response to nutrient ingestion (Table 3 and Fig. 3A). RM-ANOVA did not reveal a significant effect of macronutrient type on GN or TGN. There was an effect of macronutrient type on the integrated measure D-AUC (F(2,24) = 3.8; P = 0.037), where protein ingestion yielded the largest D-AUC (186 ± 96 h%), followed by carbohydrate (140 ± 41 h%), and lastly lipid (124 ± 106 h%). The overall ANOVA was significant, and comparing the various macronutrient pairs revealed trends for the D-AUC after protein to be greater than that after both carbohydrate (P = 0.018) and lipid (P = 0.09).
Measures of acyl and total ghrelin suppression during the 6 h after ingestion of three different macronutrient preloads of equal caloric content and volume
| Ghrelin parameters | Carbohydrate | Protein | Lipid |
|---|---|---|---|
| Acyl (n = 13) | |||
| GN (% of baseline) | 35 ± 8 | 40 ± 17 | 43 ± 19 |
| Time to nadir (min) | 89 ± 30 | 143 ± 82 | 111 ± 90 |
| D-AUCtotal (h %)a | 140 ± 41 | 186 ± 96 | 124 ± 106 |
| D-AUC0–3 (h %)a | 128 ± 29 | 98 ± 52 | 72 ± 63b |
| D-AUC3–6 (h %)a | −28 ± 79c | 88 ± 52d | 51 ± 70e |
| Total (n = 16) | |||
| GN (% of baseline)a | 70 ± 11 | 72 ± 11 | 79 ± 8f,g |
| Time to nadir (min)a | 99 ± 35 | 186 ± 82e | 169 ± 94 |
| D-AUCtotal (h %)a | 56 ± 29 | 72 ± 47 | 38 ± 30h |
| D-AUC0–3 (h %)a | 47 ± 21 | 29 ± 20i | 21 ± 22j |
| D-AUC3–6 (h %)a | −2 ± 34c | 40 ± 46b | 18 ± 19i |
All pairwise comparisons made within acyl or within total ghrelin parameters.
P < 0.05 for overall RM-ANOVA.
P = 0.006 vs. carbohydrate.
P < 0.001 vs. carbohydrate d-AUC0–3.
P ≤ 0.001 vs. carbohydrate.
P = 0.002 vs. carbohydrate.
P = 0.017 vs. protein.
P = 0.01 vs. carbohydrate.
P = 0.001 vs. protein.
P = 0.014 vs. carbohydrate.
P = 0.003 vs. carbohydrate.
Total ghrelin levels: nadir, time to nadir, and D-AUC
Fasting baseline total ghrelin levels were equivalent at the three study visits (carbohydrate session 786 ± 246 pg/ml, protein session 768 ± 290 pg/ml, and lipid session 756 ± 266 pg/ml; all comparisons P > 0.5; Table 2). Total ghrelin levels decreased significantly after each macronutrient ingestion (carbohydrate nadir 537 ± 151 pg/ml, protein nadir 562 ± 239 pg/ml, and lipid nadir 590 ± 209 pg/ml; all P < 0.0001 compared with baselines; Fig. 3B). To ensure that potential disparities between acyl vs. total ghrelin results were not due to the different number of samples analyzed, we also ran all statistical analyses for total ghrelin on only the 13 subjects who had acyl-ghrelin data. There were no differences between analyses for 16 vs. 13 subjects; therefore, we report data for all 16 subjects’ total ghrelin parameters.
We compared the efficacy of different macronutrients to suppress total ghrelin levels using GN, TGN, and D-AUC (Table 3 and Fig. 3B). RM-ANOVA revealed a significant effect of macronutrient type on GN (F(2,30) = 5.0; P = 0.015). Total ghrelin levels decreased more after carbohydrate or protein ingestion than after lipids (suppression after carbohydrate 30% vs. lipid 21%, P = 0.011; suppression after protein 28% vs. lipid 21%, P = 0.017). We also observed an effect of macronutrient type on TGN (F(2,30) = 8.0; P = 0.002). Nadir levels were reached most rapidly after carbohydrate (99 min) compared with protein (186 min; P = 0.002), or lipid (169 min; P = 0.025). Finally, the integrated measure of D-AUC varied significantly by macronutrient type (F(2,30) = 6.0; P = 0.007). Similar to acyl-ghrelin, protein ingestion caused the largest D-AUC and lipid ingestion the smallest D-AUC (72 vs. 38 h percentage, respectively; P = 0.001). The carbohydrate D-AUC was intermediate between the other two values (carbohydrate 56 h percentage vs. lipid 38 h percentage; P = 0.06).
Early and late-phase ghrelin responses to macronutrients: D-AUC0–3 and D-AUC3–6
Notably for acyl-ghrelin, but also for total ghrelin, we observed marked, macronutrient-dependent differences during the first vs. second 3-h postprandial periods of our study (Fig. 3, A and B, and Table 3). We divided our study into symmetrical early and late phases, then explored integrated measures of these two periods using D-AUC0–3 and D-AUC3–6. We found an overall effect of macronutrient type on both measures for acyl as well as total ghrelin (P < 0.01 for all ANOVAs; Table 3). For acyl and total ghrelin, the primary difference during the first 3 h was a greater carbohydrate than lipid D-AUC0–3 (acyl D-AUC0–3 128 ± 29 h % vs. 72 ± 63 h %, P = 0.006; total D-AUC0–3 47 ± 21 h % vs. 21 ± 22 h %, P = 0.003). During the second 3 h, after only carbohydrate ingestion, we observed a marked rebound of acyl-ghrelin to 37% above baseline (Fig. 3A). Therefore, significant differences were observed during this later period between AUC3–6 for carbohydrate vs. lipid (P = 0.002), and for carbohydrate vs. protein (P < 0.001); there was a trend for a difference between protein vs. lipid (P = 0.06). We also observed the rebound of total ghrelin to above baseline levels after only carbohydrate ingestion during the second 3 h (Fig. 3B). Similar to acyl-ghrelin results, protein ingestion caused the largest total ghrelin D-AUC3–6, followed by lipid, then carbohydrate, with again significant differences between AUC3–6 for carbohydrate vs. lipid (P = 0.014), and for carbohydrate vs. protein (P = 0.006), with a trend toward a difference between protein vs. lipid (P = 0.09).
The marked divergence between the early and late-phase responses after carbohydrate ingestion was significant for both acyl and total ghrelin (carbohydrate D-AUC0–3vs. D-AUC3–6; both P < 0.001). This early vs. late difference was not observed with protein or lipid ingestion, after which ghrelin remained suppressed until study completion.
Appetite measures and correlation analyses
We found no significant effect of macronutrient type on the subjective VAS appetite measures. Acyl GN and D-AUC correlated strongly with one another (r = 0.93; P < 0.01), as did total GN and D-AUC (r = 0.70; P < 0.01). None of the associations between acyl or total ghrelin parameters with insulin, glucose, triglycerides, or leptin was significant.
Discussion
To our knowledge, this is the first study assessing the response of both acyl and total ghrelin levels after consumption of oral loads of all three macronutrient types, matched for caloric content, volume, and energy density. Our novel approach, including a frequent and prolonged sampling paradigm with measurement of both total and bioactive hormone levels (via a new, highly sensitive and specific assay), produced data suggesting that, calorie for calorie, ingested lipids suppress the orexigenic hormone ghrelin less effectively than do carbohydrates or proteins. Our sampling paradigm also revealed a previously unidentified pattern in the response of acyl and total ghrelin specifically after carbohydrate ingestion. Ghrelin levels decreased in the initial 3 h, followed by a marked overshoot to above the pre-ingestion baseline during the second 3 h. No such overshoot occurred after protein or lipid ingestion, both of which suppressed acyl and total ghrelin levels until study completion. These observations suggest very different effects of high-carbohydrate meals in the early vs. later postabsorptive phase, findings that have theoretical implications for diet design. It is important to note that our findings related to carbohydrate ingestion apply to glucose and foods that are catabolized into glucose, but they may not be applicable to all carbohydrates. For example, ingested fructose, which does not increase glucose or insulin levels, suppresses ghrelin poorly (17). It is possible that the late postprandial ghrelin rebound that we observed with glucose would not occur after a fructose challenge.
Earlier experiments exploring the effects of different macronutrient classes on circulating ghrelin levels typically examined only 3-h or shorter periods; therefore, later postprandial macronutrient-specific effects have not been described (6, 18–22). In the only prior study with longer sampling, Romon et al. (7) compared the response of total ghrelin levels for 10 h after isocaloric high-carbohydrate vs. high-fat milk shakes. Although total ghrelin increased slightly above the preprandial baseline after the high-carbohydrate vs. high-fat beverage, this equivocal overshoot occurred at 6 h, later than the timing we observed. Sampling by Romon et al. (7) initially occurred hourly, then only every 2 h for the final 6 h; therefore, clear evidence of a post-carbohydrate late-onset ghrelin overshoot could have been missed. Finally, Romon et al. (7) did not measure acyl-ghrelin, in which the post-carbohydrate rebound that we observed was most pronounced.
Our finding of a rebound of total and especially acyl-ghrelin above baseline after high-carbohydrate meals could provide some physiological basis for claims made by low-carbohydrate diet advocates that ingesting carbohydrates prompts an early hunger rebound (23). Although we did not find differences in appetite ratings, some participants reported technical difficulties with our computerized VAS, possibly compromising our measurements. Evaluating the effects of macronutrient preloads on food intake at a subsequent meal may be a more objective measurement than subjective appetite reports. Bowen et al. (18) assessed total ghrelin levels for 3 h after 250-kcal carbohydrate or protein preloads, then measured voluntary intake at a subsequent meal. Ghrelin increased by the final hour of sampling after only the glucose preload. Like us, these investigators did not find any macronutrient-specific differences in VAS scores. However, their participants consumed 500 kJ more after the glucose vs. protein preload, suggesting that the ghrelin overshoot might promote greater food intake.
Beyond the possibility that early ghrelin rebound after carbohydrate ingestion might contribute to an early return of hunger, another potential explanation for that early post-carbohydrate hunger pertains to faster gastric emptying after ingestion of carbohydrates compared with lipids or proteins. Interestingly, postprandial changes in ghrelin levels, gastric emptying, and hunger might all be interrelated. Nutrients suppress ghrelin via post-gastric mechanisms (24). The rapid exodus of carbohydrates from the stomach should cause a rapid, strong suppression of ghrelin levels, an effect that might be short lived because these nutrients are quickly absorbed and metabolized. The prolonged suppression observed after lipids and proteins might relate to their prolonged emptying from the stomach, causing more sustained activation of post-gastric ghrelin-suppressing mechanisms. Conversely, because ghrelin stimulates gastric emptying, the post-carbohydrate ghrelin rebound could accelerate gastric emptying. Thus, macronutrient-related effects on ghrelin secretion might help explain macronutrient-related effects on gastric emptying.
Although mechanisms mediating the biphasic ghrelin response to carbohydrate ingestion are unknown, insulin is a potential contributor. Insulin administration suppresses ghrelin secretion (25), and the temporal profiles of ghrelin and insulin levels after meals mirror one another (4). We explored possible correlations between ghrelin, insulin, and glucose parameters, but found none. Admittedly, our ability to detect correlations is limited by our small sample size. In addition, our subjects had wide-ranging BMI, and presumably insulin sensitivity, heterogeneities that could increase variability in the relationship between insulin and ghrelin (26). Beyond simple correlational relationships between ghrelin and insulin or glucose levels, more complex mechanisms relating to insulin-mediated glucose metabolism may control postprandial ghrelin levels. Griffen et al. (27) found that among type 1 diabetic patients treated with equivalent total insulin doses via lispro vs. NPH-plus-regular, those treated with the former experienced better glucose control and greater postprandial ghrelin suppression, suggesting that glucose uptake and metabolism may mediate the effects of insulin to suppress ghrelin. Our post-carbohydrate overshoot of ghrelin to above baseline levels coincided with a decrease of glucose to below baseline, although insulin levels at that time had not yet returned to baseline. If insulin-mediated glucose disposal is more important than mere insulin levels for ghrelin suppression, the late post-carbohydrate ghrelin overshoot may result from reduced intracellular glucose metabolism when glucose levels decreased below baseline.
Candidate mechanisms to explain weak ghrelin suppression by lipids are more apparent. We have shown that insulin mediates part of postprandial ghrelin suppression (28). Thus, the poor stimulation of insulin by lipids should contribute to the weak ability of this macronutrient class to suppress ghrelin. Moreover, we find that postprandial increases of intestinal osmolarity contribute to ghrelin suppression (29). Although it was not measured directly, the osmolarity of our lipid beverages was likely lower than that of our isocaloric carbohydrate or protein beverages because, calorie for calorie, lipids contribute fewer osmolar units than do carbohydrates or proteins. The lesser suppression of an orexigenic hormone by ingested lipids could, theoretically, represent one of many mechanisms by which high-fat diets contribute to weight gain (12, 13), and, interestingly, we have found that low-fat diet-induced weight loss occurs without compensatory ghrelin increase (30).
The D-AUC, which best reflects the overall magnitude of postprandial ghrelin suppression, was greatest after protein ingestion, an observation consistent with prior reports (19, 20, 31, 32). Concurrent with this persistent suppression of acyl and total ghrelin levels was an equally durable elevation of insulin that was not observed after carbohydrate or lipid ingestions. Although this reciprocal pattern suggests a role for insulin in the long-lasting effect of protein on ghrelin suppression, we did not find significant correlations between ghrelin or insulin parameters. Relatively strong suppression of ghrelin by proteins is provocative, given that proteins reduce appetite more than equivalent calories of carbohydrates or lipids do (33–35). Many popular weight-reducing diets are relatively high in protein percentage, whether they are designed to be low fat, low carbohydrate, or specifically high protein (36). Theoretically, the relatively high-protein content of these diets should suppress ghrelin levels well, potentially contributing to their weight-reducing effects. Our short-term findings justify further research to investigate this possibility regarding popular diets.
Our study has several limitations. We administered test meals with very large, balanced differences in macronutrient composition. Although this permits clearer assessments regarding the effects of specific macronutrients, our test meals were not typical foods. Similarly, we chose liquid meals so that we could match volume and energy density, but liquids comprise a minority of overall caloric intake. Our attempts to quantify appetite perception were hindered by technical difficulties with a small, handheld computerized VAS system. Finally, we studied relatively few individuals, albeit thoroughly, and this group might not be representative of the general population.
Despite these limitations, our study offers several advantages. First, we measured both acyl-ghrelin and total ghrelin. Second, the novel sandwich ELISA that we developed and used in this study detects only intact, acylated ghrelin, and it is highly sensitive and specific (41). The majority of prior studies on this topic only examined total ghrelin, and among the few investigators who attempted to measure acyl-ghrelin (19–21, 31), some appear not to have taken adequate steps to protect the highly unstable acylated form from degradation during sample handling. Third, unlike studies that only investigated one or two macronutrient classes (7, 18, 19, 21, 22), we assessed, within-subjects, the effects of ingested carbohydrate, lipid, and protein on ghrelin levels. Fourth, we carefully designed our meals to be isocaloric, isovolemic, and of equal energy density for a given individual, so that these factors would not confound our results, as has occurred with some studies (5, 37–39). Furthermore, we varied macronutrient composition symmetrically, so that we could assign macronutrient-specific effects with greater clarity than is possible from prior works using more complex variations in test meals (6, 20, 31). Finally, we obtained samples every 20 min for 6 h, a frequent and prolonged sampling paradigm that has not been previously used to assess macronutrient-related ghrelin regulation (6, 18–22). This allowed us to detect and characterize the late-phase rebound of ghrelin levels to above preprandial values specifically after carbohydrate ingestion.
The macronutrient composition of ingested food differentially affects postprandial ghrelin suppression. Although the mechanisms by which specific macronutrients regulate circulating ghrelin are not fully known, our results could help explain the ability of high-protein diets to cause weight loss as well as the tendency for high-fat diets to promote weight gain (12, 13, 40). Our observations suggest that macronutrient-specific effects on postprandial ghrelin should be considered when designing weight-reducing diets; however, our findings must first be tested with appropriately designed diets in long-term interventions.
Acknowledgments
We thank D. Scott Weigle, Pat Breen, and Colleen Matthys for their critical input to our study design; Margaret Pepe, Tessa Rue, and Jim Patrie for their statistical expertise; R. Scott Frayo for his assistance with study procedures; John H. Sloan for assistance with total ghrelin assays; and Hendrik Geysen for his expertise during the development of the acyl-ghrelin assay. We also thank our volunteers for their participation in the study.
This study was supported by research Grant R01 DK61516 from the National Institute of Diabetes and Digestive and Kidney Diseases (to D.E.C.). The research was conducted in the General Clinical Research Center at the University of Washington, which is funded by National Center for Research Resources Grant M01-RR-00037. K.E.F.-S. is supported by Grant K12 RR023265-03 from the National Center for Research Resources.
Disclosure Statement: K.E.F.-S., J.O., C.E.P., J.L., H.S.C., and B.D.G. have nothing to declare. M.O.T. consults for Novo Nordisk and Tercica. D.E.C. consults for Novo Nordisk, Barosense, and Elixer Pharmaceuticals.
Abbreviations
- BMI,
Body mass index;
- CV,
coefficient of variation;
- D-AUC,
decremental area under the ghrelin curve;
- D-AUC0–3,
0- to 3-h decremental area under the ghrelin curve;
- D-AUC3–6,
3- to 6-h decremental area under the ghrelin curve;
- GN,
ghrelin nadir;
- RM-ANOVA,
repeated-measures ANOVA;
- TEE,
total daily energy expenditure;
- TGN,
time to ghrelin nadir;
- VAS,
visual analog scale.
