
Glycaemia Fluctuations Improvement in Old-Age Prediabetic Subjects Consuming a Quinoa-Based Diet: A Pilot Study

 , , , , , and
Abstract
:1. Introduction
2. Methods
2.1. Participants
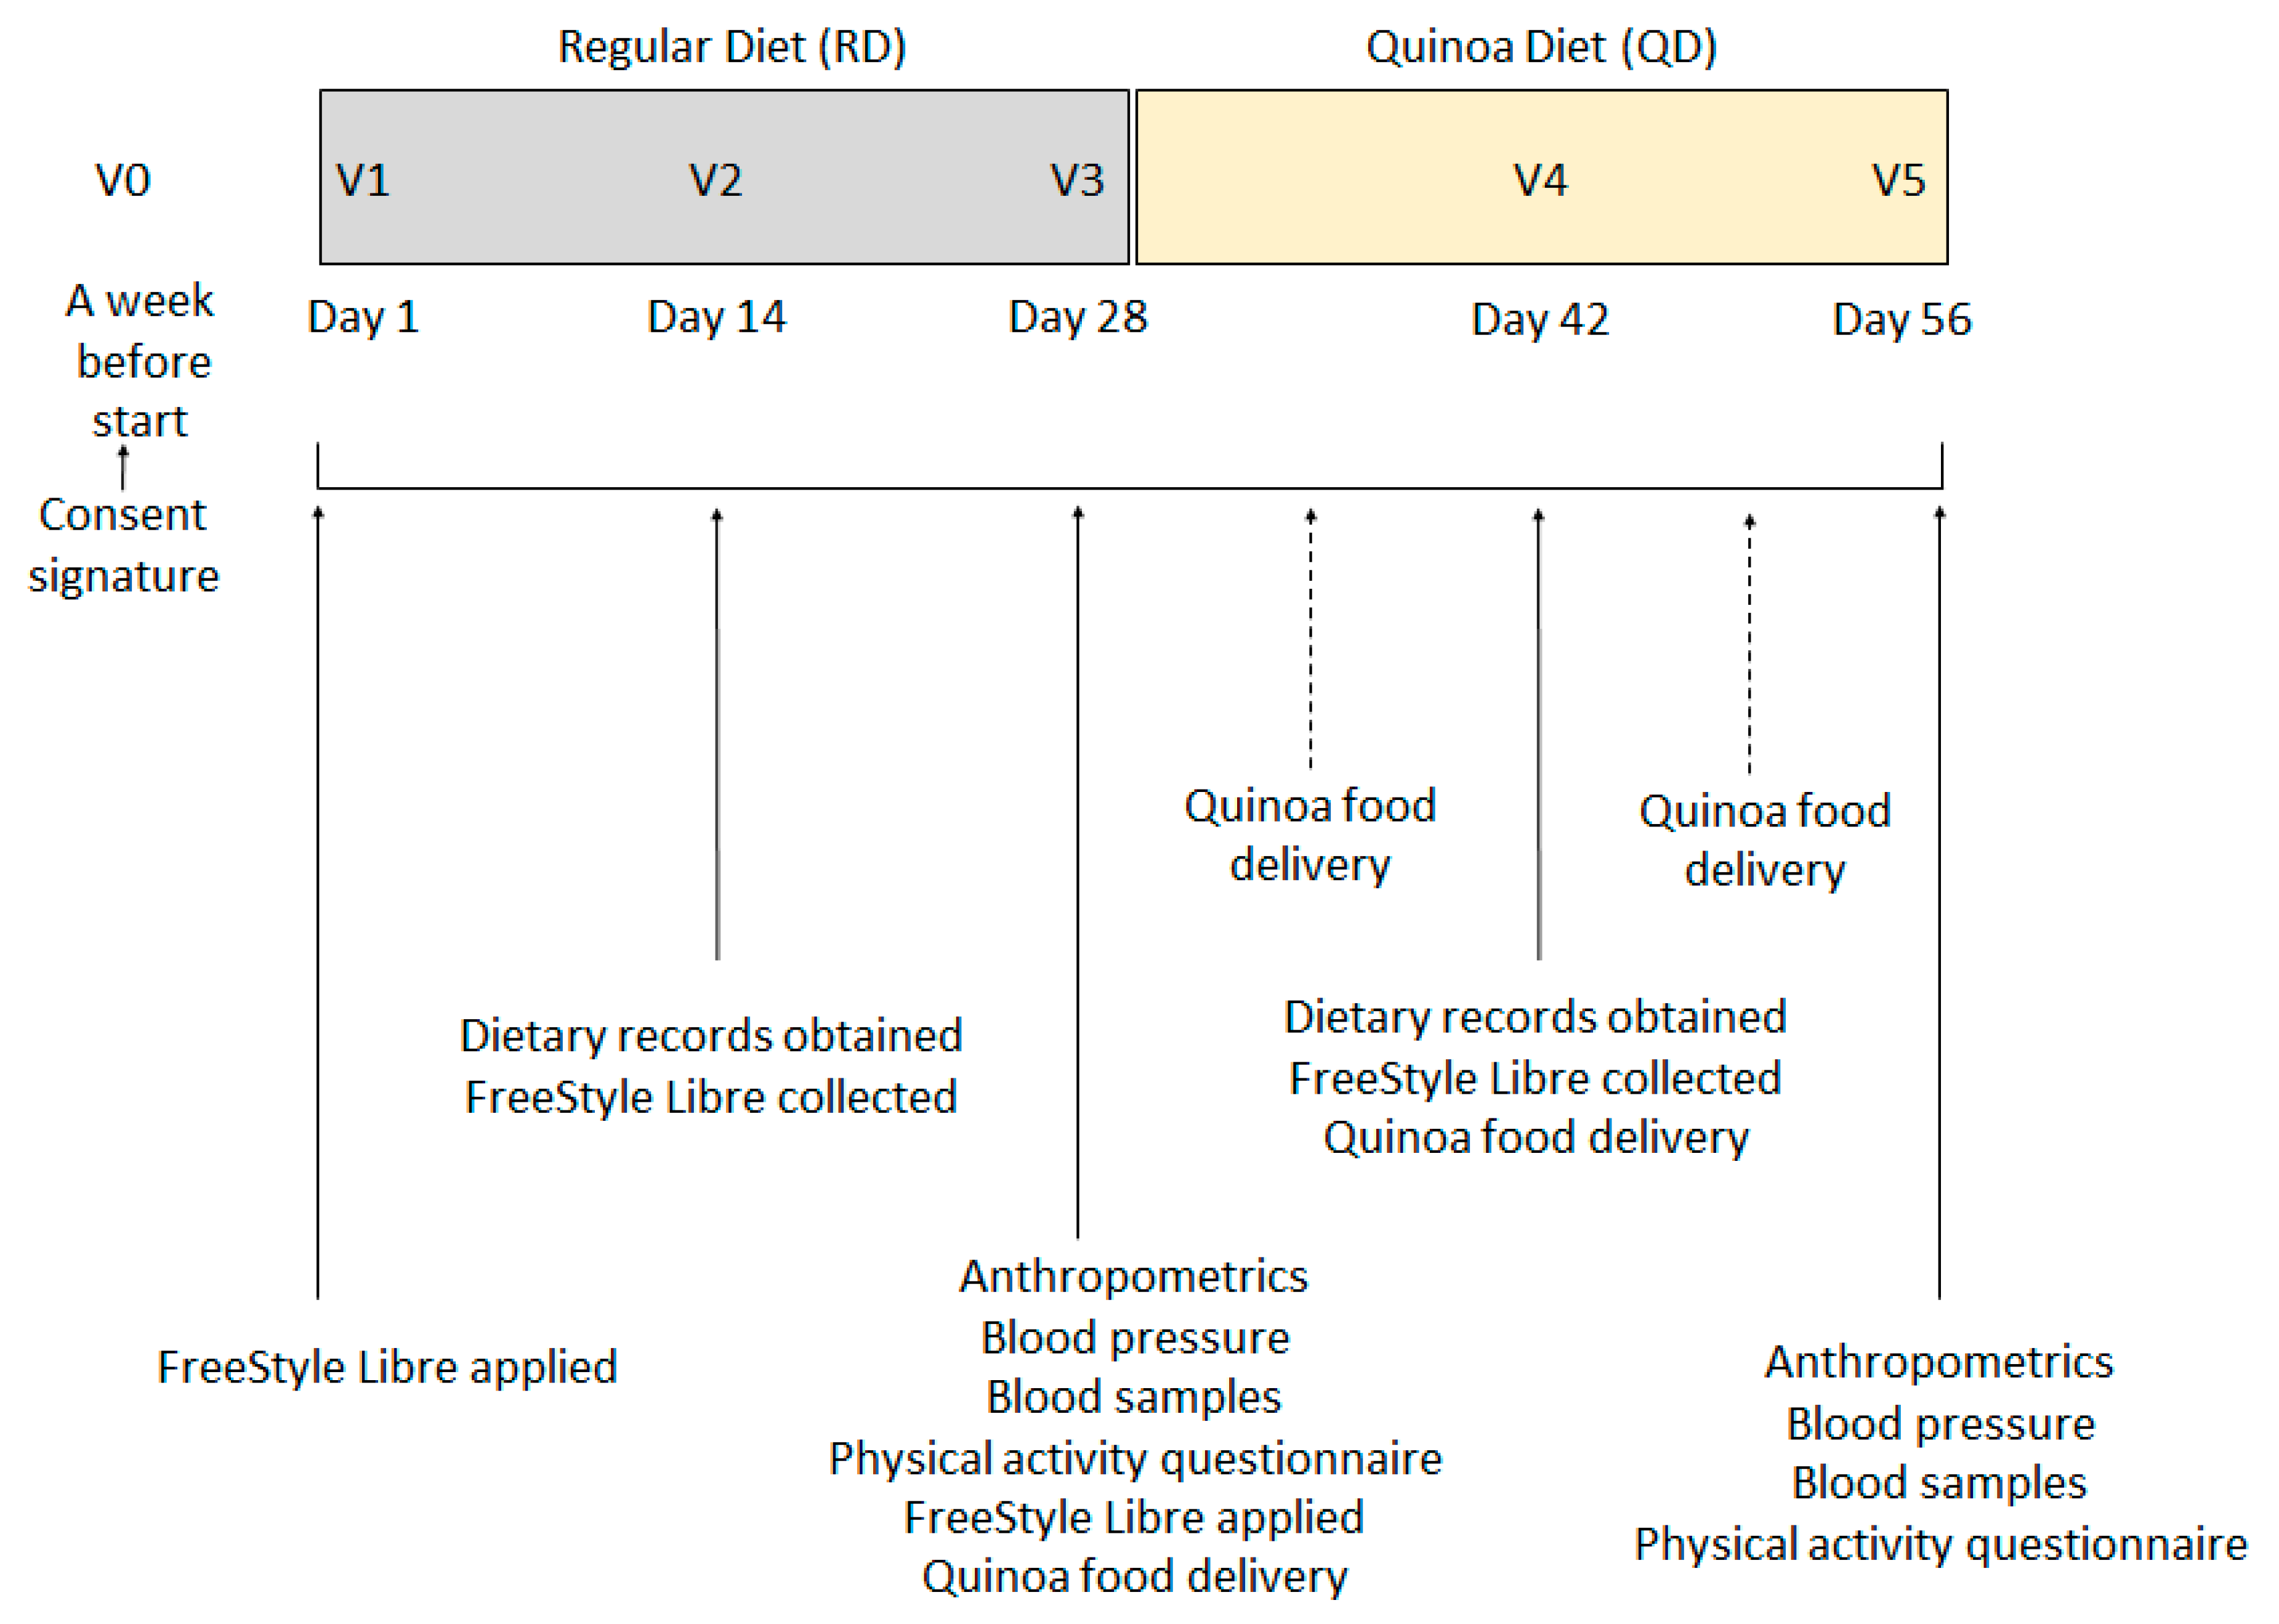
2.2. Study Design
2.3. Study Food
2.4. Calculations and Statistical Analyses
2.5. Data Availability Statement
3. Results
3.1. Participant Characteristics
3.2. Anthropometric Measurements and Blood Tests
3.3. Dietary Intake Differences
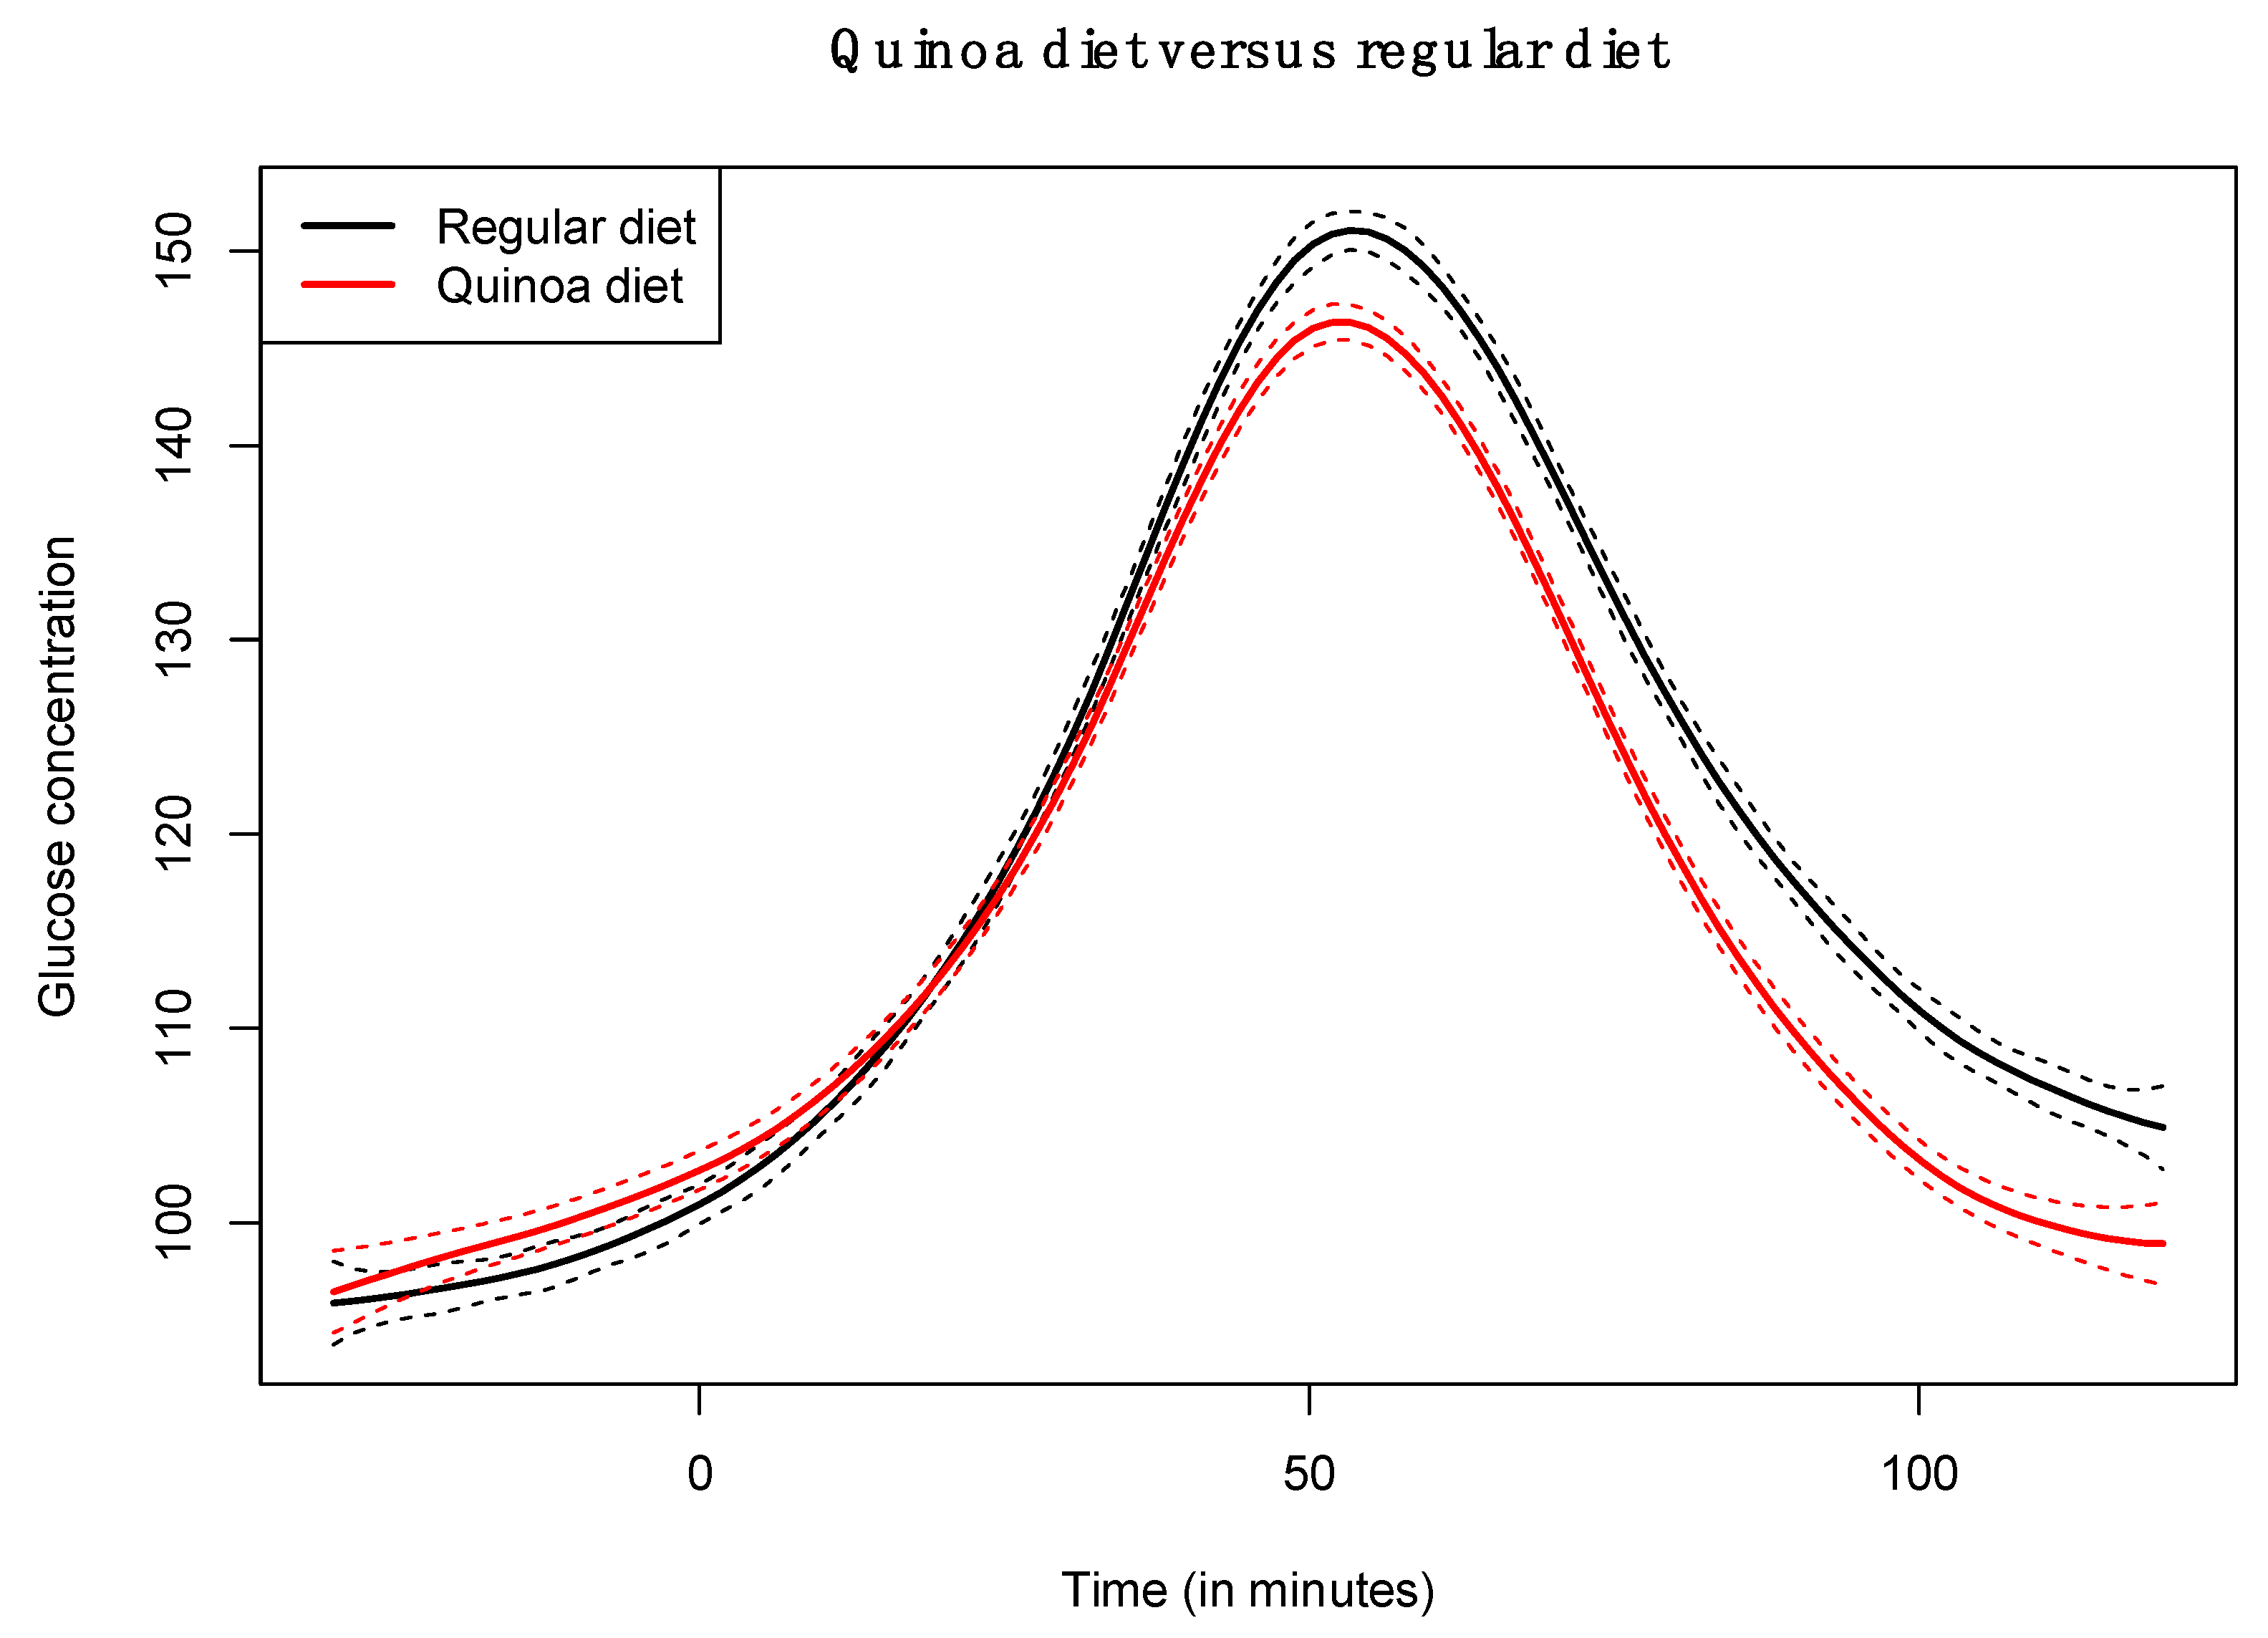
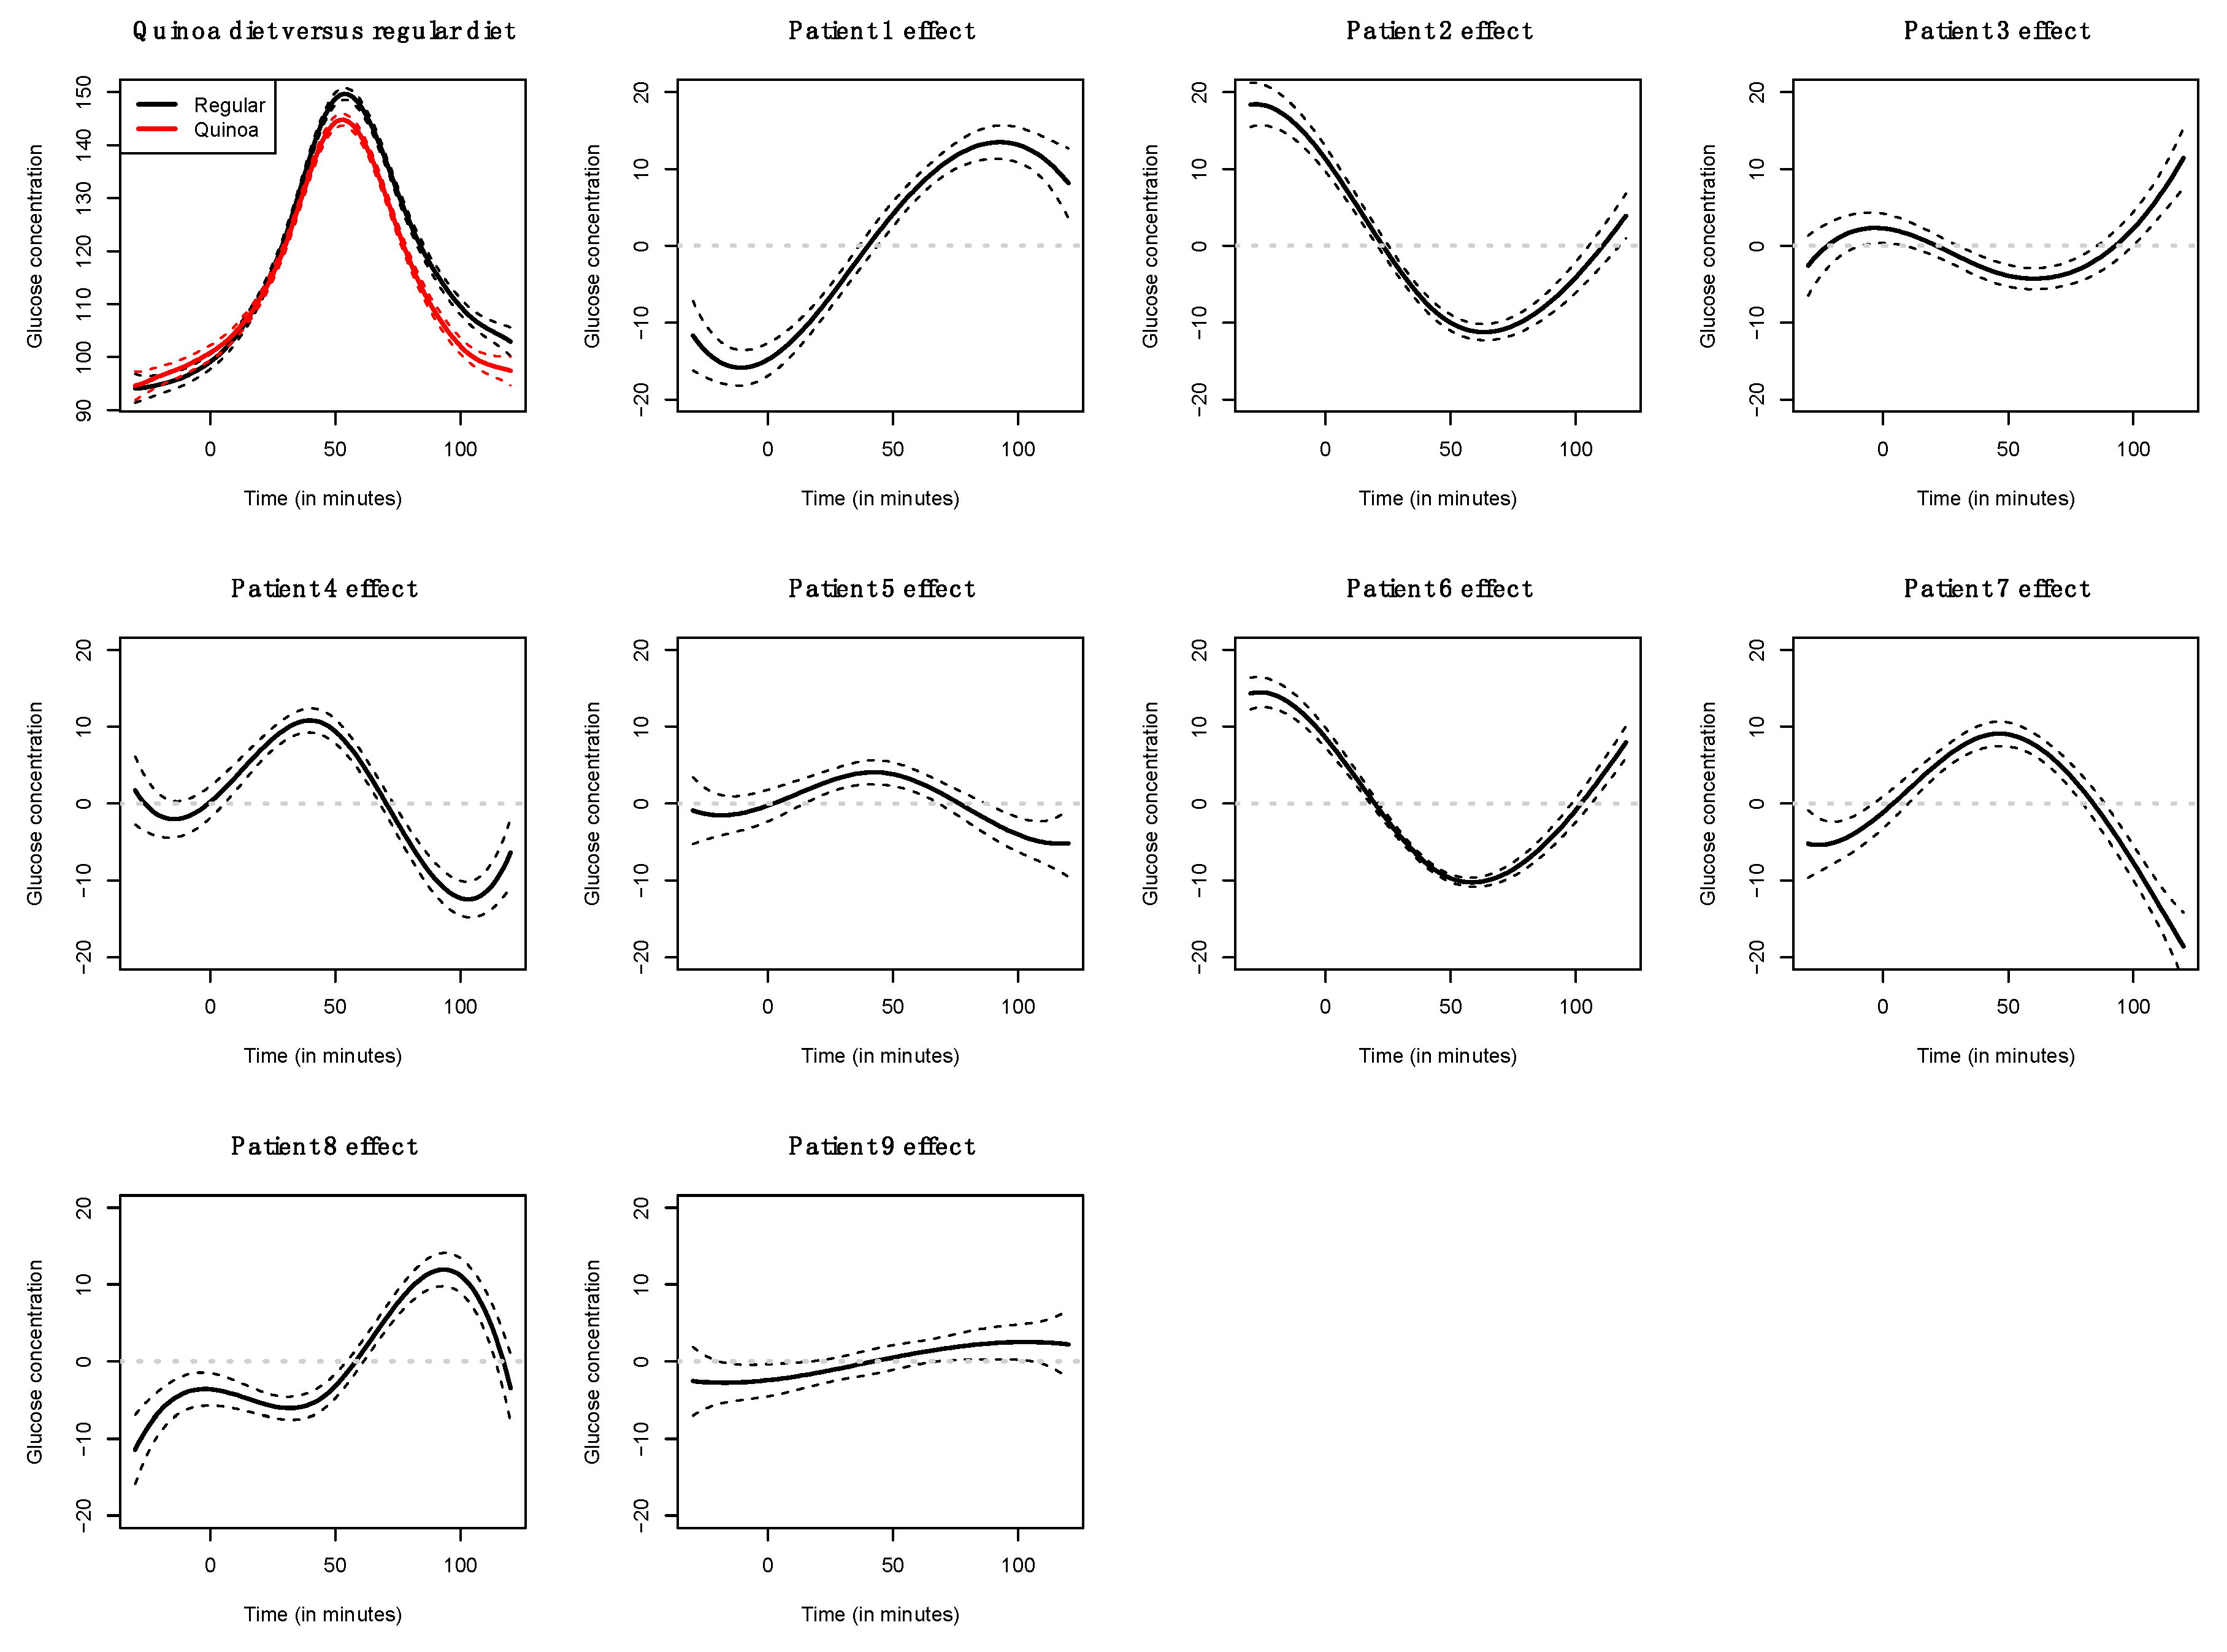
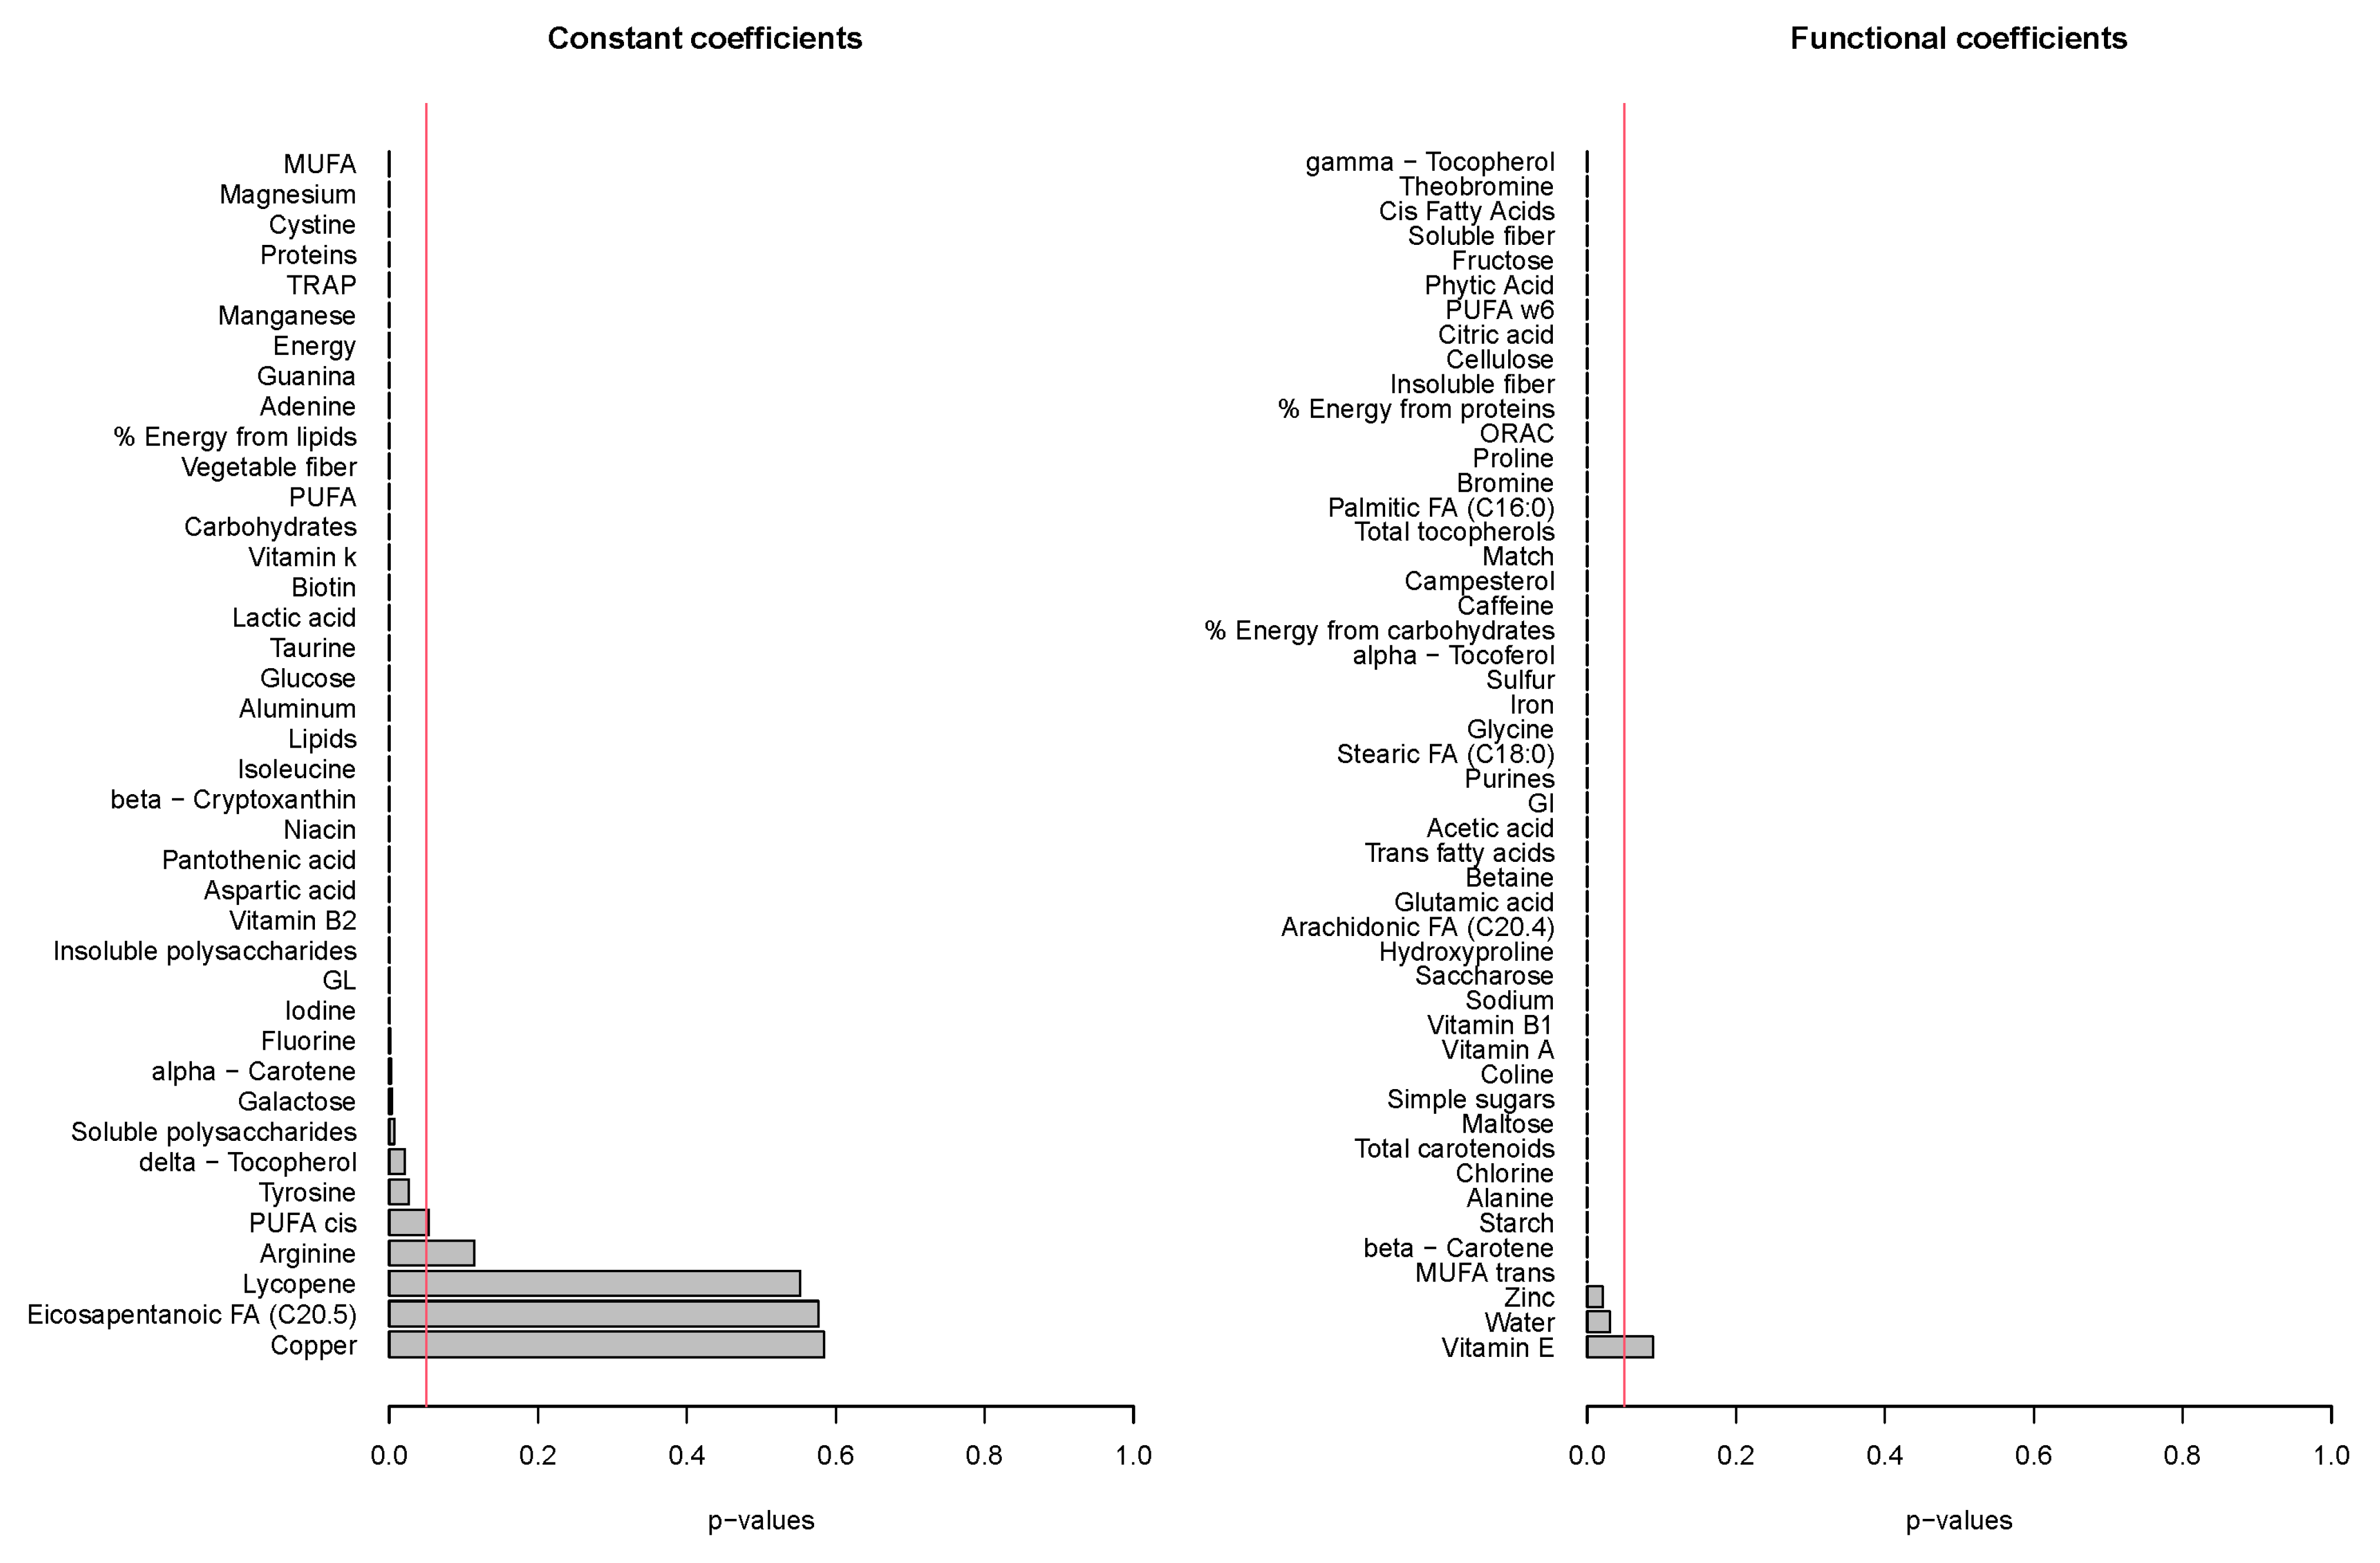
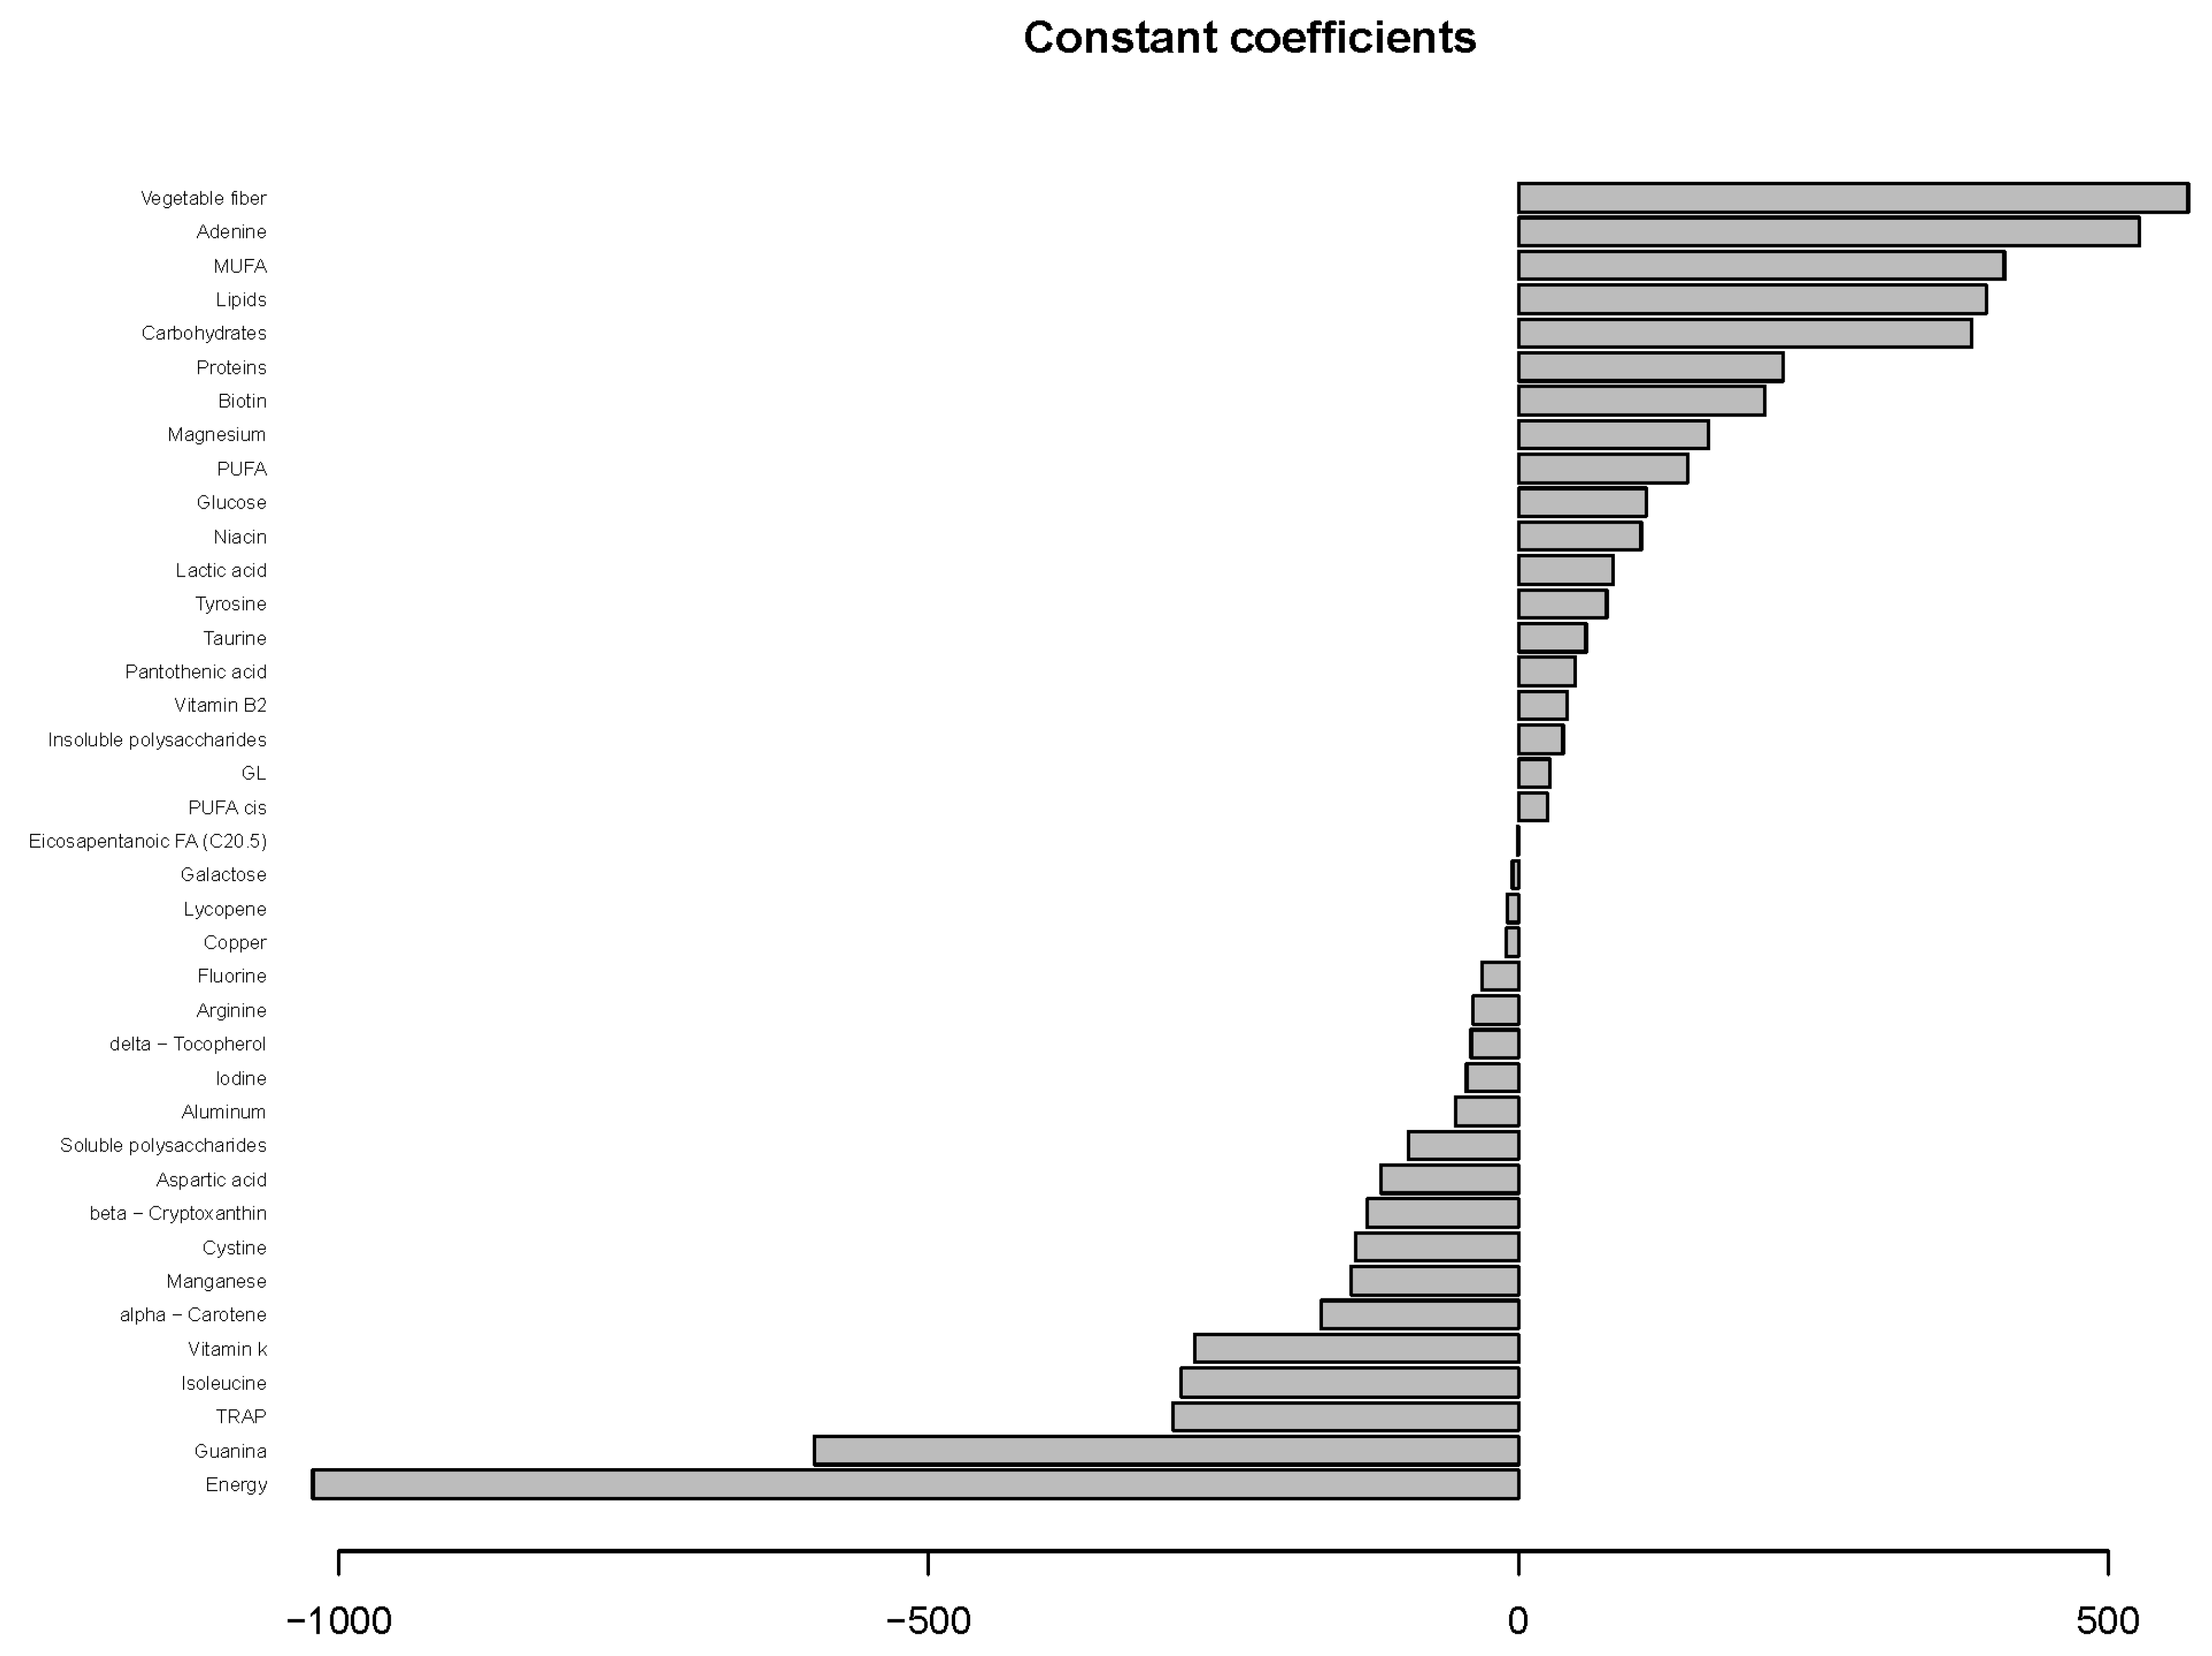
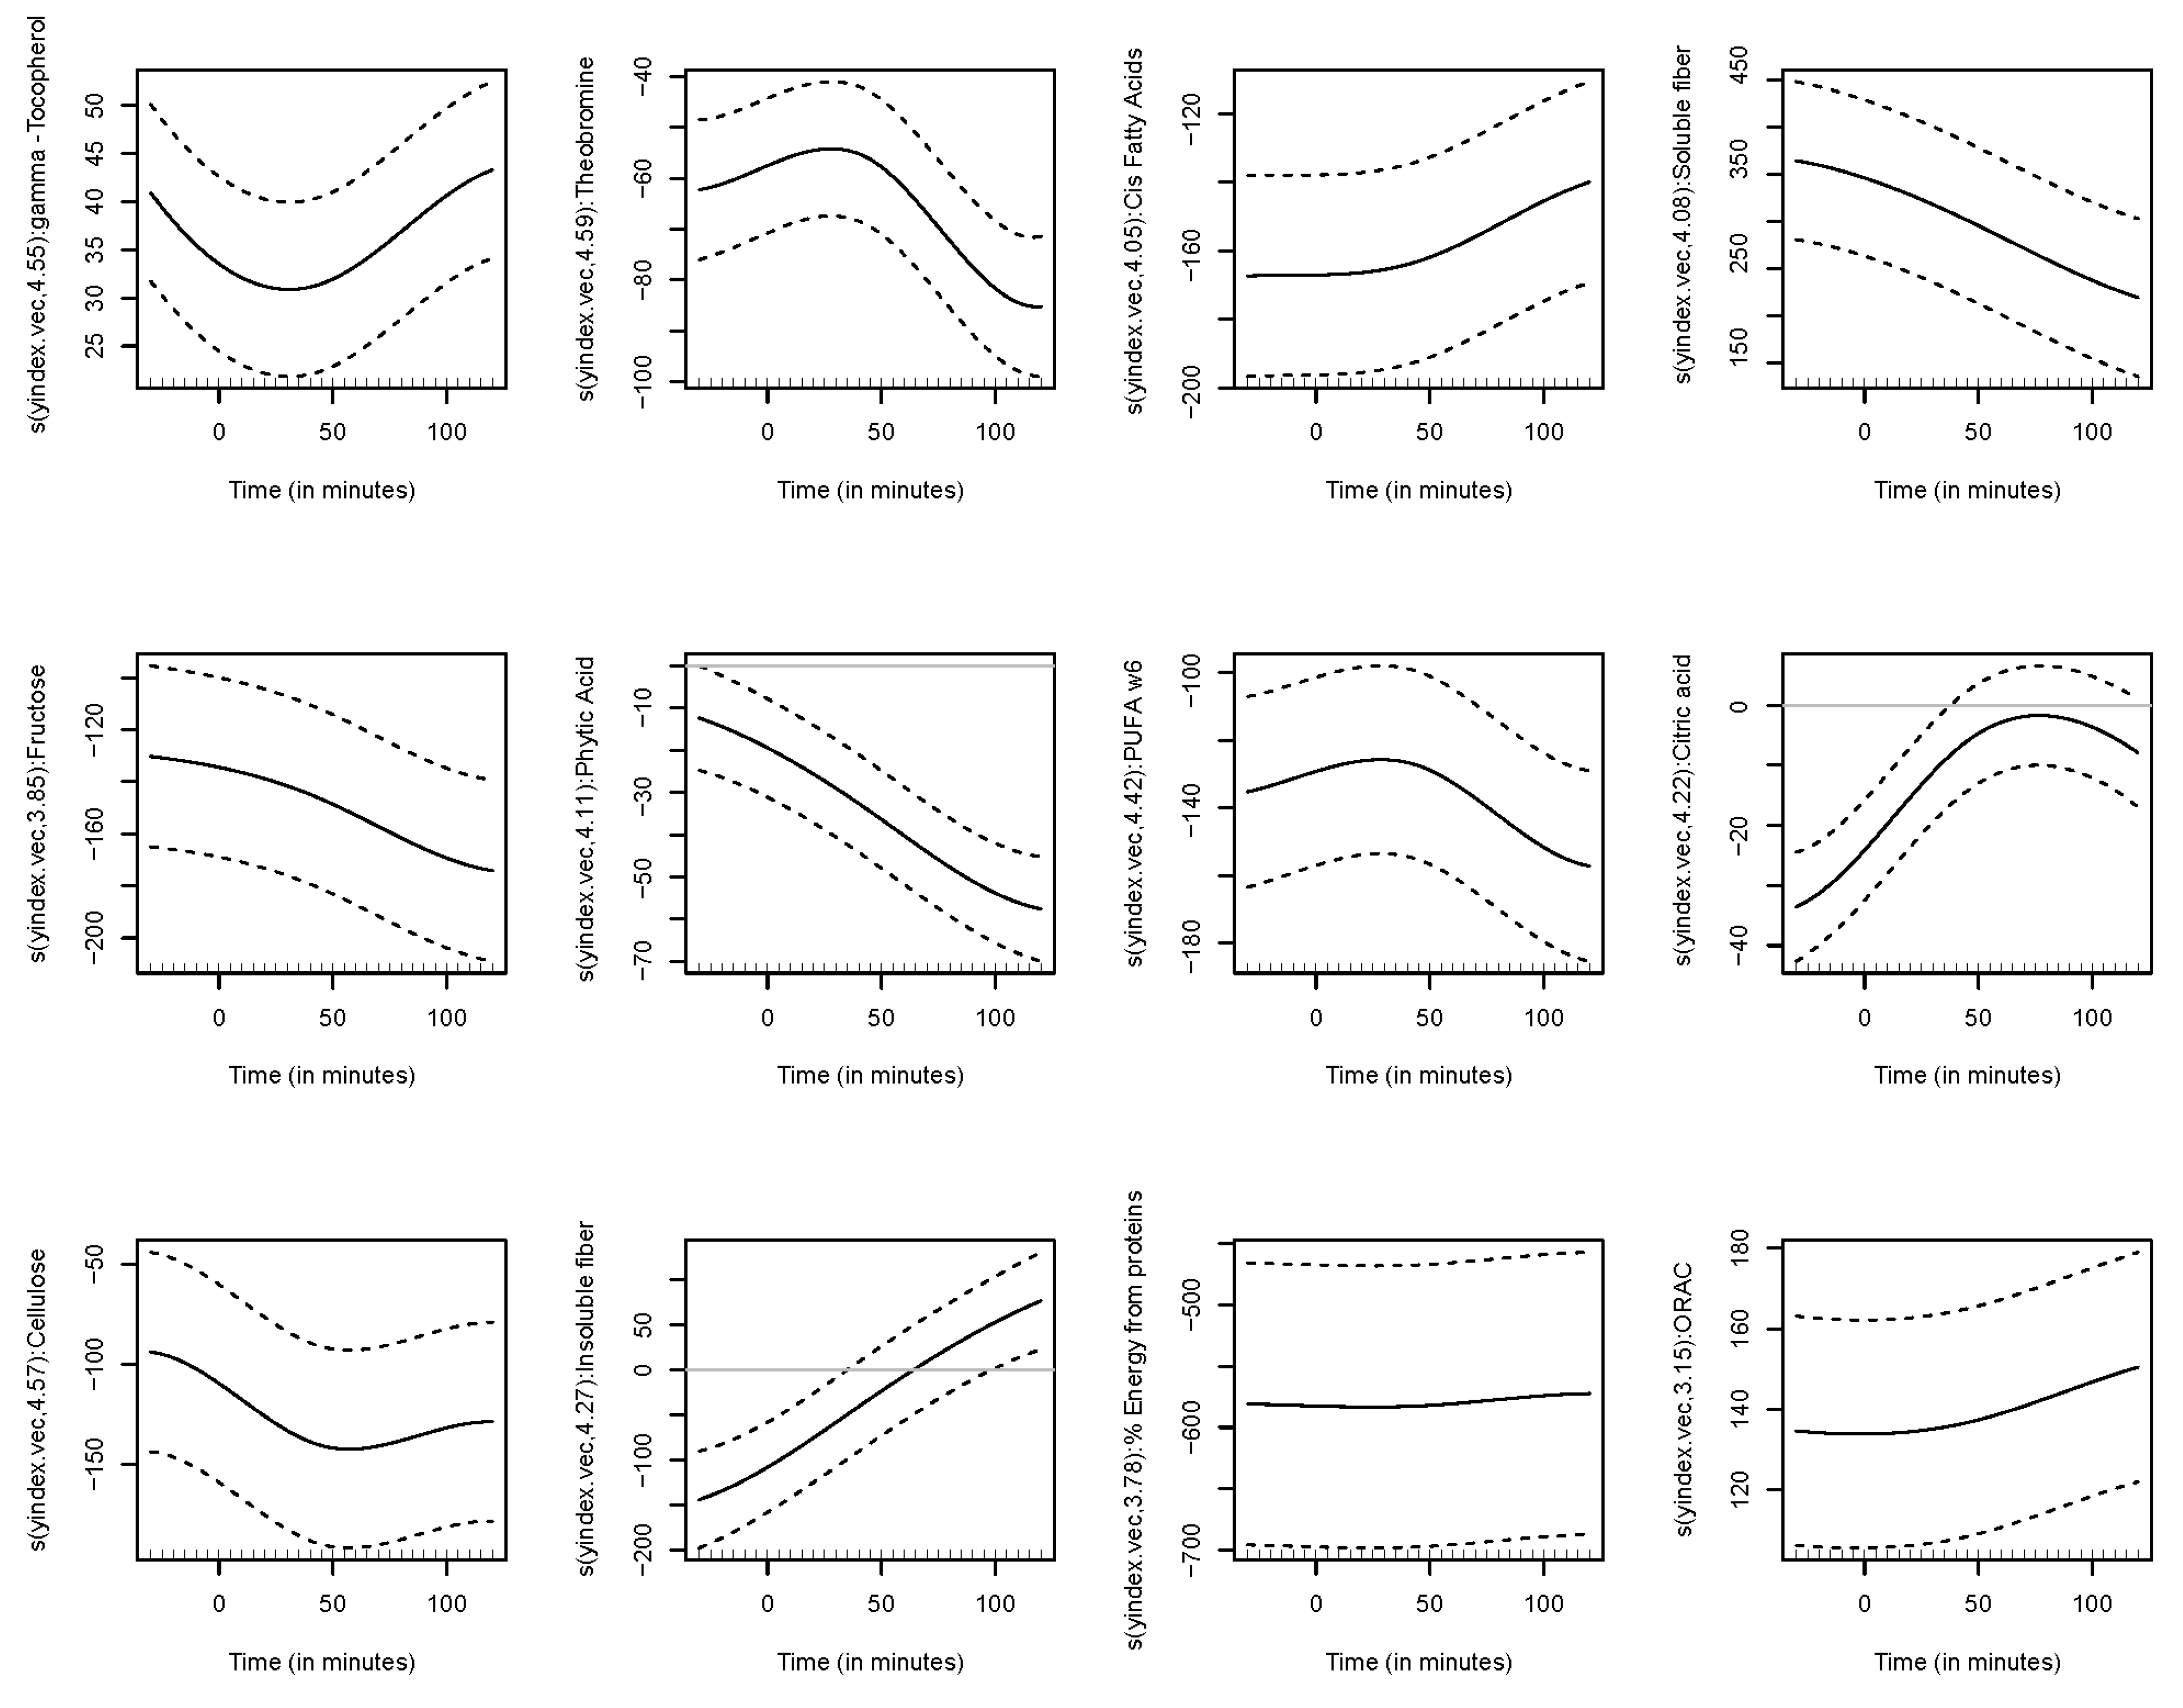
3.4. Results of Functional Regression Models
4. Discussion
5. Strengths
6. Limitations
7. Conclusions
Supplementary Materials
Author Contributions
Funding
Institutional Review Board Statement
Informed Consent Statement
Acknowledgments
Conflicts of Interest
References
- Gordillo-Bastidas, E.; Díaz-Rizzolo, D.A.; Roura, E.; Massanés, T.; Gomis, R. Quinoa (Chenopodium quinoa Willd), from Nutritional Value to Potential Health Benefits: An Integrative Review. J. Nutr. Food Sci. 2016, 6, 497. [Google Scholar] [CrossRef] [Green Version]
- Gómez-Caravaca, A.M.; Iafelice, G.; Verardo, V.; Marconi, E.; Caboni, M.F. Influence of pearling process on phenolic and saponin content in quinoa (Chenopodium quinoa Willd). Food Chem. 2014, 157, 174–178. [Google Scholar] [CrossRef] [PubMed]
- Tang, Y.; Zhang, B.; Li, X.; Chen, P.X.; Zhang, H.; Liu, R.; Tsao, R. Bound phenolics of quinoa seeds released by acid, alkaline, and enzymatic treatments and their antioxidant and α-glucosidase and pancreatic lipase inhibitory effects. J. Agric. Food Chem. 2016, 64, 1712–1719. [Google Scholar] [CrossRef] [PubMed]
- Siah, S.D.; Konczak, I.; Agboola, S.; Wood, J.A.; Blanchard, C.L. In vitro investigations of the potential health benefits of Australian-grown faba beans (Vicia faba L.): Chemopreventative capacity and inhibitory effects on the angiotensin-converting enzyme, α-glucosidase and lipase. Br. J. Nutr. 2012, 108, S123–S134. [Google Scholar] [CrossRef] [Green Version]
- Zhang, B.; Deng, Z.; Ramdath, D.D.; Tang, Y.; Chen, P.X.; Liu, R.; Liu, Q.; Tsao, R. Phenolic profiles of 20 Canadian lentil cultivars and their contribution to antioxidant activity and inhibitory effects on α-glucosidase and pancreatic lipase. Food Chem. 2015, 172, 862–872. [Google Scholar] [CrossRef]
- Zhang, Y.; Bai, B.; Yan, Y.; Liang, J.; Guan, X. Bound Polyphenols from Red Quinoa Prevailed over Free Polyphenols in Reducing Postprandial Blood Glucose Rises by Inhibiting α-Glucosidase Activity and Starch Digestion. Nutrients 2022, 14, 728. [Google Scholar] [CrossRef]
- Maki, K.C.; Phillips, A.K. Dietary substitutions for refined carbohydrate hat show promise for reducing risk of type 2 diabetes in men and women. J. Nutr. 2015, 145, 159S–163S. [Google Scholar] [CrossRef] [Green Version]
- WHO (World Health Organization). International Encyclopedia of Public Health. 2018. Available online: http://www.who.int/diabetes/en/ (accessed on 20 December 2021).
- American Diabetes Association. Standards of Medical Care in Diabetes 2020. Diabetes Care 2020, 43 (Suppl. 1), S14–S31. [Google Scholar]
- Forouhi, N.G.; Luan, J.; Hennings, S.; Wareham, N.J. Incidence of Type 2 diabetes in England and its association with baseline impaired fasting glucose: The Ely study 1990–2000. Diabet Med. 2007, 24, 200–207. [Google Scholar] [CrossRef]
- Nathan, D.M.; Davidson, M.B.; De Fronzo, R.A.; Heine, R.J.; Henry, R.R.; Pratley, R.; Zinman, B.; American Diabetes Association. Impaired fasting glucose and impaired glucose tolerance: Implications for care. Diabetes Care 2007, 30, 753–759. [Google Scholar] [CrossRef] [Green Version]
- Narayan, K.V.; Boyle, J.P.; Geiss, L.S.; Saaddine, J.B.; Thompson, T.J. Impact of recent increase in incidence on future diabetes burden. Diabetes Care 2006, 29, 2114–2116. [Google Scholar] [CrossRef] [PubMed] [Green Version]
- Vilcacundo, R.; Hernández-Ledesma, B. Nutritional and biological value of quinoa (Chenopodium quinoa Willd.). Curr. Opin Food Sci. 2017, 14, 1–6. [Google Scholar] [CrossRef] [Green Version]
- Li, L.; Lietz, G.; Bal, W.; Watson, A.; Morfey, B.; Seal, C. Effects of Quinoa (Chenopodium quinoa Willd.) Consumption on Markers of CVD Risk. Nutrients 2018, 10, 777. [Google Scholar] [CrossRef] [PubMed] [Green Version]
- Ramsay, J.; Silverman, B.W. Functional Data Analysis; Springer: Berlin/Heidelberg, Germany, 2005. [Google Scholar]
- Carroll, C.; Gajardo, A.; Chen, Y.; Dai, X.; Fan, J.; Hadjipantelis, P.Z.; Han, K.; Ji, H.; Mueller, H.G.; Wang, J.L. Fdapace: Functional Data Analysis and Empirical Dynamics. R Package Version 0.5.4. 2020. Available online: https://CRAN.R-project.org/package=fdapace (accessed on 25 May 2022).
- Goldsmith, J.; Scheipl, F.; Huang, L.; Wrobel, J.; Gellar, J.; Harezlak, J.; McLean, M.W.; Swihart, B.; Xiao, L.; Crainiceanu, C.; et al. Refund: Regression with Functional Data. R Package Version 0.1-17. 2018. Available online: https://CRAN.R-project.org/package=refund (accessed on 25 May 2022).
- Oliver Sáez, P.; Gómez-Peralta, F. Glucosa y HbA1c en el Laboratorio y Como Point-of-Care Tesing en Diferentes Entornos Clínicos. Barcelona: Comité de Comunicación de la Sociedad Española de Medicina de Laboratorio. 2019. Available online: https://www.seen.es/ModulGEX/workspace/publico/modulos/web/docs/apartados/986/060420_101837_2799907673.pdf (accessed on 4 May 2020).
- Hall, K.D.; Guo, J. Obesity Energetics: Body Weight Regulation and the Effects of Diet Composition. Gastroenterology 2017, 152, 1718–1727. [Google Scholar] [CrossRef] [Green Version]
- Hall, K.D. A review of the carbohydrate-insulin model of obesity. Eur. J. Clin. Investig. 2017, 71, 323–326. [Google Scholar] [CrossRef] [PubMed]
- Fine, E.J.; Feinman, R.D. Thermodynamics of weight loss diets. Nutr. Metab. 2004, 1, 15. [Google Scholar] [CrossRef] [Green Version]
- Soenen, S.; Bonomi, A.G.; Lemmens, S.G.; Scholte, J.; Thijssen, M.A.; Van Berkum, F.; Westerterp-Plantenga, M.S. Relatively high-protein or ‘low-carb’ energy-restricted diets for body weight loss and body weight maintenance? Physiol. Behav. 2012, 107, 374–380. [Google Scholar] [CrossRef]
- Díaz-Rizzolo, D.; Kostov, B.; López-Siles, M.; Serra, A.; Colungo, C.; González-De-Paz, L.; Martinez-Medina, M.; Sisó-Almirall, A.; Gomis, R. Healthy dietary pattern and their corresponding gut microbiota profile are linked to a lower risk of type 2 diabetes, independent of the presence of obesity. Clin. Nutr. 2020, 39, 524–532. [Google Scholar] [CrossRef] [Green Version]
- Ludwig, D.S. The glycemic index: Physiological mechanisms relating to obesity, diabetes, and cardiovascular disease. JAMA 2002, 287, 2414–2423. [Google Scholar] [CrossRef]
- Gabrial, S.G.; Shakib, M.-C.R.; Gabrial, G.N. Effect of pseudocereal-based breakfast meals on the first and second meal glucose tolerance in healthy and diabetic subjects. Maced. J. Med. Sci. 2016, 4, 565–573. [Google Scholar] [CrossRef] [Green Version]
- Zeevi, D.; Korem, T.; Zmora, N.; Israeli, D.; Rothschild, D.; Weinberger, A.; Ben-Yacov, O.; Lador, D.; Avnit-Sagi, T.; Lotan-Pompan, M.; et al. Personalized Nutrition by Prediction of Glycemic Responses. Cell 2015, 163, 1079–1094. [Google Scholar] [CrossRef] [PubMed] [Green Version]
- Wolever, T.M.; Bhaskaran, K. Use of glycemic index to estimate mixed-meal glycemic response. Am. J. Clin. Nutr. 2012, 95, 256–257. [Google Scholar] [CrossRef] [Green Version]
- Kim, J.S.; Nam, K.; Chung, S.-J. Effect of nutrient composition in a mixed meal on the postprandial glycemic response in healthy people: A preliminary study. Nutr. Res. Pract. 2019, 13, 126–133. [Google Scholar] [CrossRef] [PubMed]
- Chehade, J.M.; Sheikh-Ali, M.; Mooradian, A.D. The Role of Micronutrients in Managing Diabetes. Diabetes Spectr. 2009, 22, 214–218. [Google Scholar] [CrossRef] [Green Version]
- Jacobs, D.R.; Gross, M.D.; Tapsell, L.C. Food synergy: An operational concept for understanding nutrition. Am. J. Clin. Nutr. 2009, 89, 1543S–1548S. [Google Scholar] [CrossRef] [PubMed]
- Proctor, S.D.; Kelly, S.E.; Stanhope, K.L.; Havel, P.J.; Russell, J.C. Synergistic effects of conjugated linoleic acid and chromium picolinate improve vascular function and renal pathophysiology in the insulin-resistant JCR:LA-cp rat. Diabetes Obes. Metab. 2006, 9, 87–95. [Google Scholar] [CrossRef]
- Ruales, J.; Nair, B.M. Content of fat, vitamins and minerals in quinoa (Chenopodium quinoa Willd.) seeds. Food Chem. 1993, 48, 131–136. [Google Scholar] [CrossRef]
- Repo-Carrasco-Valencia, R.; Encina-Zelada, C.R. Determinación de la capacidad antioxidante y compuestos fenólicos de cereales andinos: Quinua (Chenopodium quinoa), kañiwa (Chenopodium pallidicaule) y kiwicha (Amaranthus caudatus). Rev. Soc. Química Perú 2008, 74, 85–99. [Google Scholar]
- United States Department of Agriculture. Agricultural Research Service; National Nutrient Database for Standard Reference Legacy Release. Available online: https://www.usda.gov/ (accessed on 24 July 2019).
- Marmouzi, I.; El Madani, N.; Charrouf, Z.; Cherrah, Y.; El Abbes Faouzi, M.Y. Proximate analysis, fatty acids and mineral composition of processed Moroccan Chenopodium quinoa Willd. and antioxidant properties according to the polarity. Phytothérapie 2015, 13, 110–117. [Google Scholar] [CrossRef]
- Chito Trujilloa, D.M.; Ortega Bonillab, R.A.; Ahumada Mamiána, A.F.; Rosero López, B. Quinoa (Chenopodium quinoa Willd.) versus soja (Glycine max [L.] Merr.) en la nutrición humana: Revisión sobre las características agroecológicas, de composición y tecnológicas. Rev. Esp. Nutr. Hum. Diet. 2017, 21, 184–198. [Google Scholar] [CrossRef] [Green Version]
- Repo-Carrasco-Valencia, R.A.-M.; Serna, L.A. Quinoa (Chenopodium quinoa, Willd.) as a source of dietary fiber and other functional components. Food Sci. Technol. 2011, 31, 225–230. [Google Scholar] [CrossRef] [Green Version]
- Panfili, G.; Fratianni, A.; Irano, M. Normal phase high performance liquid chromatography method for the determination of tocopherols and tocotrienols in cereals. J. Agric. Food Chem. 2003, 51, 3940–3944. [Google Scholar] [CrossRef] [PubMed]
- Chiasson, J.-L.; Josse, R.G.; Gomis, R.; Hanefeld, M.; Karasik, A.; Laakso, M. Acarbose for Prevention of Type 2 Diabetes Mellitus: The STOP-NIDDM Randomised Trial. Lancet 2002, 359, 2072–2077. [Google Scholar] [CrossRef]
- Gallwitz, B. Implications of postprandial glucose and weight control in people with type 2 diabetes: Understanding and implementing the International Diabetes Federation guidelines. Diabetes Care 2009, 32, S322–S325. [Google Scholar] [CrossRef] [PubMed] [Green Version]
- Jenkins, D.J.A.; Kendall, C.W.C.; McKeown-Eyssen, G.; Josse, R.G.; Silverberg, J.; Booth, G.L.; Vidgen, E.; Josse, A.R.; Nguyen, T.H.; Corrigan, S.; et al. Effect of a low-glycemic index or a high-cereal fiber diet on type 2 diabetes a randomized trial. JAMA 2008, 300, 2742–2753. [Google Scholar] [CrossRef] [PubMed] [Green Version]
- Farinazzi-Machado, F.M.V.; Barbalho, S.M.; Oshiiwa, M.; Goulart, R.; Pessan, O. Use of cereal bars with quinoa (Chenopodium quinoa w) to reduce risk factors related to cardiovascular diseases. Cienc. Tecnol. Aliment. 2012, 32, 239–244. [Google Scholar] [CrossRef] [Green Version]
- De Carvalho, F.G.; Ovidio, P.P.; Padovan, G.J.; Jordao, A.A.; Marchini, J.S.; Navarro, A.M. Metabolic parameters of postmenopausal women after quinoa or corn flakes intake—A prospective and double-blind study. Int. J. Food Sci. Nutr. 2014, 65, 380–385. [Google Scholar] [CrossRef]
- Zevallos, V.F.; Herencia, L.I.; Chang, F.J.; Donnelly, S.; Ellis, H.J.; Ciclitira, P.J. Gastrointestinal effects of eating quinoa (Chenopodium quinoa willd.) in celiac patients. Am. J. Gastroenterol. 2014, 109, 270–278. [Google Scholar] [CrossRef]


| Variables | V1 | V3 | V5 | p-Value | ||
|---|---|---|---|---|---|---|
| Median (Q1, Q3) | Median (Q1, Q3) | Median (Q1, Q3) | V1 vs. V3 | V3 vs. V5 | V1 vs. V5 | |
| Weight | 75 (69, 76.5) | 74.8 (69, 77.4) | 73.2 (68, 76.7) | 0.075 | 0.008 | 0.021 |
| BMI | 26.6 (26.2, 31.2) | 26.8 (26.5, 31.1) | 26.2 (26.1, 30.4) | 0.063 | 0.004 | 0.021 |
| Waist | 93 (86.5, 96.5) | 93.5 (84, 96) | 92 (83, 95.7) | 0.310 | 0.015 | 0.012 |
| Hip | 104.9 (100, 109) | 105.5 (100, 110) | 103 (100, 105.5) | 0.722 | 0.043 | 0.213 |
| Waist/hip | 0.89 (0.83, 0.92) | 0.86 (0.84, 0.91) | 0.87 (0.82, 0.89) | 0.398 | 0.281 | 0.182 |
| SBP | 128.7 (124.7, 135) | 126.3 (121.3, 136) | 125.7 (122.2, 133.2) | 0.859 | 0.446 | 0.109 |
| DBP | 84.7 (74.7, 85.3) | 78.3 (76, 89.3) | 75.7 (71.3, 88.8) | 0.678 | 0.055 | 0.833 |
| HR | 66 (62.7, 67) | 66.3 (62.3, 69) | 66.8 (63, 71.2) | 0.496 | 0.641 | 0.293 |
| Fasting glucose | 102 (100, 114) | 97 (96, 101) | 96 (93, 100) | 0.021 | 1.000 | 0.021 |
| Hs-CRP | 0.35 (0.23, 0.72) | 0.23 (0.13, 0.36) | 0.21 (0.12, 0.4) | 1.000 | 0.734 | 0.917 |
| CRP | 6.8 (6.5, 6.9) | 7.0 (6.9, 7.2) | 6.9 (6.7, 7.0) | 0.027 | 0.058 | 0.223 |
| Cholesterol | 182 (163.5, 194) | 195 (179, 220) | 182 (174, 198) | 0.156 | 0.263 | 0.446 |
| Triglycerides | 71 (56.5, 113.5) | 90 (80, 121) | 86 (69, 132) | 0.463 | 0.477 | 0.686 |
| HDL | 49 (44.5, 58) | 52 (47, 63) | 51 (50, 54) | 1.000 | 0.726 | 0.799 |
| LDL | 110 (103.5, 142) | 127.6 (97, 141.8) | 108 (104.4, 137.2) | 0.469 | 0.250 | 0.938 |
| Serum albumin | 43 (42, 46) | 43 (41, 45) | 0.565 | |||
| Insulin | 12.3 (10.7, 16.8) | 13 (9.1, 18.2) | 1.000 | |||
| HbA1c | 6.1 (5.9, 6.3) | 5.5 (5.3, 5.6) | 0.007 | |||
Publisher’s Note: MDPI stays neutral with regard to jurisdictional claims in published maps and institutional affiliations. |
© 2022 by the authors. Licensee MDPI, Basel, Switzerland. This article is an open access article distributed under the terms and conditions of the Creative Commons Attribution (CC BY) license (https://creativecommons.org/licenses/by/4.0/).
Share and Cite
Díaz-Rizzolo, D.A.; Acar-Denizli, N.; Kostov, B.; Roura, E.; Sisó-Almirall, A.; Delicado, P.; Gomis, R. Glycaemia Fluctuations Improvement in Old-Age Prediabetic Subjects Consuming a Quinoa-Based Diet: A Pilot Study. Nutrients 2022, 14, 2331. https://doi.org/10.3390/nu14112331
Díaz-Rizzolo DA, Acar-Denizli N, Kostov B, Roura E, Sisó-Almirall A, Delicado P, Gomis R. Glycaemia Fluctuations Improvement in Old-Age Prediabetic Subjects Consuming a Quinoa-Based Diet: A Pilot Study. Nutrients. 2022; 14(11):2331. https://doi.org/10.3390/nu14112331
Chicago/Turabian StyleDíaz-Rizzolo, Diana A., Nihan Acar-Denizli, Belchin Kostov, Elena Roura, Antoni Sisó-Almirall, Pedro Delicado, and Ramon Gomis. 2022. "Glycaemia Fluctuations Improvement in Old-Age Prediabetic Subjects Consuming a Quinoa-Based Diet: A Pilot Study" Nutrients 14, no. 11: 2331. https://doi.org/10.3390/nu14112331