- India
- International
Saturday, May 11, 2024
Journalism of Courage
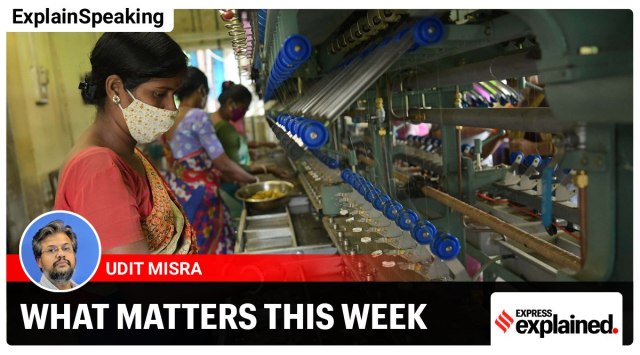 In India’s case, the biggest engine of growth is private consumption (C) demand from individuals. In pic, workers at a silk factory in Agartala. (Express File Photo by Abhisek Saha)
ExplainSpeaking-Economy is a weekly newsletter by Udit Misra, delivered in your inbox every Monday morning. Click here to subscribe
Dear Readers,
On May 31, the Ministry of Statistics and Programme Implementation (MoSPI) will release the so-called “Provisional Estimates (or PEs)” of GDP for the last financial year (2021-22).
Before we get to what PEs are, here is a quick definition of GDP.
The GDP measures the monetary value of all “final” goods and services—that is, those that are bought by the final user—produced in a country in a given period of time (say a quarter or a year). For more on GDP, read this piece.
The provisional estimates are important because they will be the first formal estimates of how India grew in the full financial year 2021-22.

In the past, MoSPI has released two “advance” estimates of GDP.
The first advance estimates (FAEs) were released on January 7th and they expected India’s GDP to grow by 9.2% in 2021-22. Of course, coming as they did on January 7th, the FAEs were largely based on the data from just the first two quarters — April to June and July to September. Read this piece to learn more about the FAEs.
Next, in end-February, the MoSPI updated the FAEs by adding data for the third quarter (October to December). These were labelled as the second advance estimates (SAEs). The SAEs dialled down the full-year growth to 8.9%. Read this piece to understand what the SAEs told us about the economy.
The provisional estimates (or PEs) that will be released on August 31 will go a step further. They will add the data from the fourth quarter (January to March) and thus provide the most complete picture of how India’s economy performed in 2021-22.
To be sure, thanks to the Covid disruption, India’s economy had contracted by 6.6% in 2020-21. As such, the GDP growth in 2021-22 will tell us the extent of India’s economic recovery. A good way to do this is to compare every metric to where it was in 2019-20 since that is the pre-Covid level.
Apart from telling us how robust was India’s recovery, the provisional estimates will also set the base on which the current financial year’s GDP growth will be calculated.
For any financial year, the two main variables of national income are GDP and GVA (or Gross Value Added). The GDP calculates India’s national income by adding up all the expenditures in the economy while the GVA calculates the national income from the supply side by looking at the value-added in each sector of the economy.
While both the variables measure national income, they are linked as follows:
GDP = (GVA) + (Taxes earned by the government) — (Subsidies provided by the government).
As such, if the government earned more from taxes than what it spent on subsidies, GDP will be higher than GVA. If, on the other hand, the government provided subsidies in excess of its tax revenues, the absolute level of GVA would be higher than the absolute level of GDP.
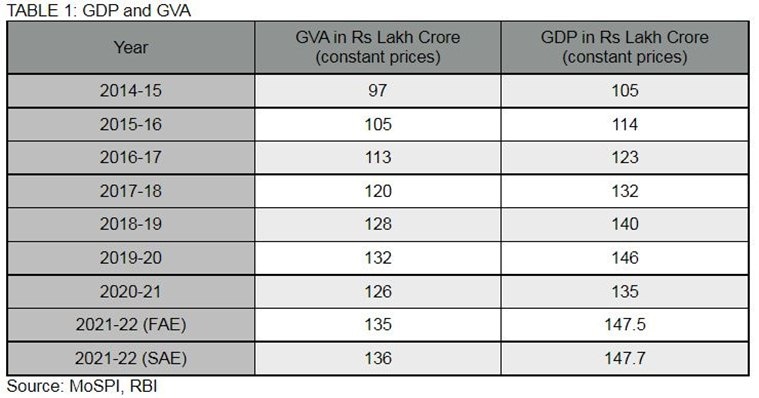 Table 1: GDP and GVA levels since 2014
Table 1 details the GDP and GVA levels since 2014. The key year to compare FY22 is FY20, which is the pre-Covid year.
While the overall GDP level is important to know where the economy is vis-a-vis the pre-Covid, it is important to note for people to know what is causing growth and what is dragging India’s growth. This is where the sub-components of GDP come into the picture.
Knowledge about them helps us understand how sustainable India’s economic recovery is.
Broadly speaking, GDP has four engines of growth in any economy.
In India’s case, for instance, the biggest engine is private consumption (C) demand from individuals. This demand typically accounts for 56% of all GDP and is technically called the “Private Final Consumption Expenditure” or PFCE.
The second-biggest engine is the money spent on investments (I). This accounts for 32% of all GDP in India; and is technically called Gross Fixed Capital Formation or GFCF.
The third engine of GDP growth is the money spent by the government G) towards meeting its day-to-day arrangements. This demand accounts for 11% of India’s GDP, and is called “Government Final Consumption Expenditure (GFCE)”.
The fourth engine of GDP growth is the money spent on “Net Exports” (NX). The NX is nothing but the money spent by Indians on foreign goods (that is, India’s imports) subtracted from the money spent by foreigners on Indian goods and services (that is, India’s exports). Since in most years India imports more than it exports, the NX is the smallest engine of GDP growth and is often negative.
So, GDP = C (or PFCE) + I (or GFCF) + G (or GFCE) + NX
Table 2 details the different components of GDP and how they contributed to the overall GDP.
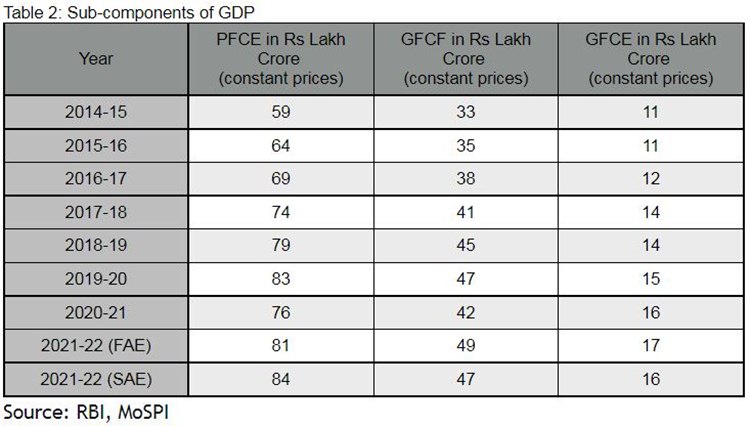 Table 2: Different components of GDP
Readers will note that there were dramatic differences in the sub-components between the FAEs and SAEs.
Often, overall GDP does not tell us the full picture.
To get a better understanding of how an average Indian is affected, the GDP datasheet also looks at per capita income (or p.c. GDP) and per capita expenditure (or per capita PFCE).
Table 3 details the situation in these two variables.
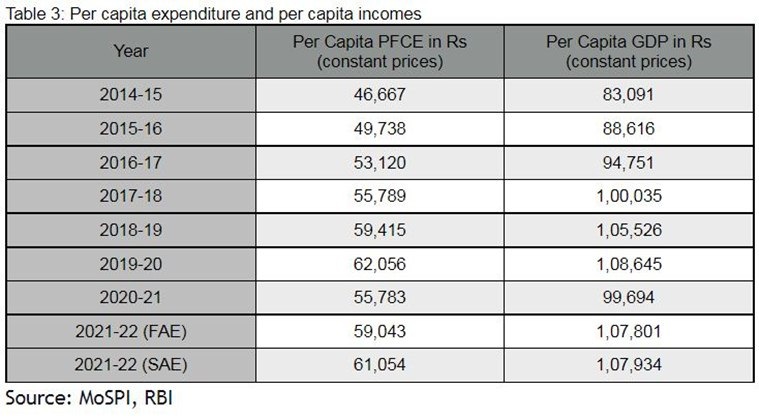 Table 3: While the overall level of GDP and expenditure may have crossed the 2019-20 level, in per capita terms India continues to struggle
The key thing to note is that while the overall level of GDP and expenditure may have crossed the 2019-20 level (Table 1), in per capita terms India continues to struggle.
The provisional estimates include the first official estimates for GVA for the fourth quarter as well as the whole financial year. The sub-components of GVA tell us which sectors of the economy are doing well and which ones are struggling to grow.
Table 4 shows the break up of the economy into eight productive sectors and the GVA in each of them.
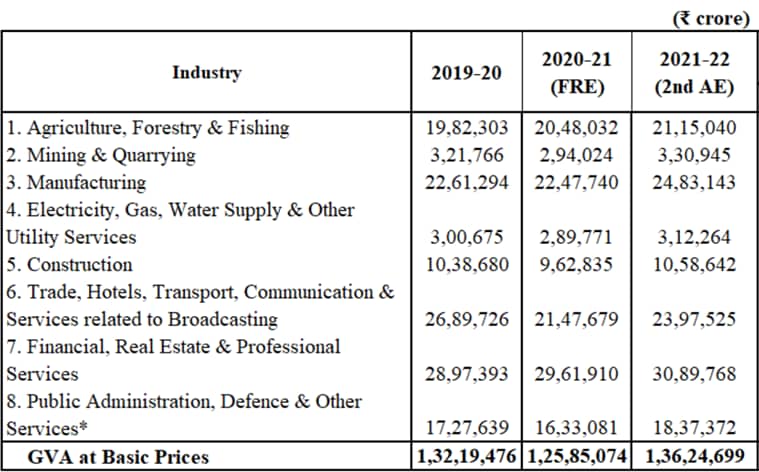 Table 4: Break up of the economy into 8 productive sectors
The way to read this table is to again compare the amount of value-added in a particular sector (say manufacturing) in 2021-22 and then compare it with the 2019-20 (pre-Covid) level. This set of data is based on the SAEs. But the provisional estimates will update all these data points.
What do you expect India’s GDP growth to be in the last financial year? More importantly, what do you think India’s GDP will be in the current financial year? Share your views and queries at udit.misra@gmail.com.
Stay safe,
Udit

Berlin portrays loneliness of deaf and speech-impairedSubscriber Only

How predators, and prey, know there is safety in numbersSubscriber Only

1980 Lok Sabha elections: Triumph and tragedy of IndiraSubscriber Only

Sthal is personal, says director Jayant Digambar SomalkarSubscriber Only