- India
- International
Tuesday, Apr 23, 2024
Journalism of Courage
 Labourers rest on a hot day in Lucknow, May 31, 2022. (AP Photo/Rajesh Kumar Singh)
India’s gross domestic product (GDP) grew by 8.7% in 2021-22 (or FY22) according to the “provisional estimates” released by the Ministry of Statistics and Programme Implementation on Tuesday. This growth comes at the back of a 6.6% contraction in GDP during 2020-21 when the pandemic led to massive disruptions and widespread lockdowns. The GDP measures the value of all “final” goods and services— those that are bought by the final user— produced in a country in a given period (say a quarter or a year).
The data released also showed that the Gross Value Added (or GVA) — another measure of national income — grew by 8.1% in FY22. In FY21, GVA had contracted by 4.8%.
The key questions are: Has the recovery in FY22 been good enough to recover from the contraction of FY21? If so, have all sectors recovered? If the recovery isn’t “broad-based”, which sectors or sections remain behind where they were before Covid struck?
🚨 Limited Time Offer | Express Premium with ad-lite for just Rs 2/ day 👉🏽 Click here to subscribe 🚨
While the GDP calculates national income by adding up all expenditures in the economy, the GVA calculates the national income from the supply side by looking at the value added in each sector of the economy.

The two measures of national income are linked as follows:
GDP = GVA + Taxes earned by the government — Subsidies provided by the government
As such, if the government earned more from taxes than it spent on subsidies, GDP will be higher than GVA. If, on the other hand, if the government provided subsidies in excess of its tax revenues, the absolute level of GVA would be higher than that of GDP.
Simply put, GDP provides the demand side of the economy, and GVA the supply side.
What do the data show?
As Chart 1 shows, at the aggregate level, in terms of GDP as well as GVA, the economy has gone past the pre-Covid level (FY20). In other words, it has recovered all the lost ground due to the contraction in FY21. However, the sub-components of GDP and GVA reveal the true extent of this recovery.
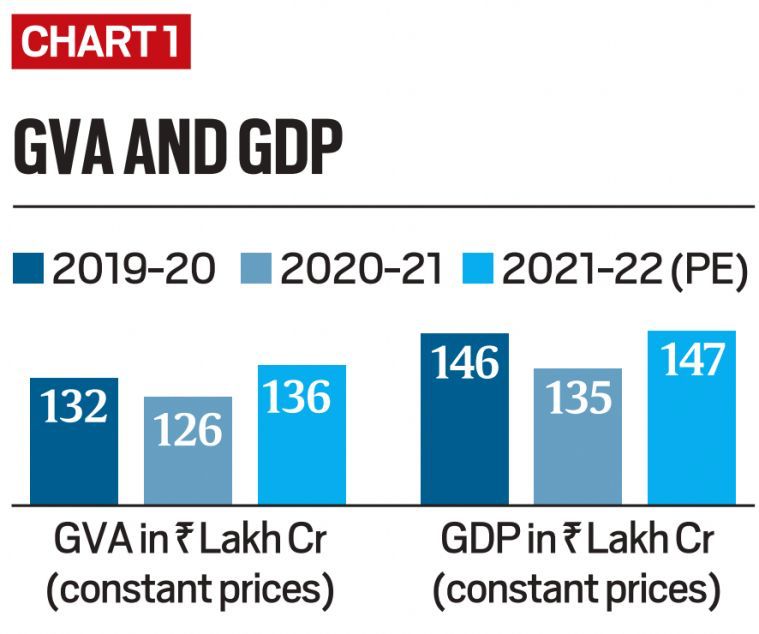 Simply put, GDP provides the demand side of the economy, and GVA the supply side. (Source: MoSPI)
What do the GDP data show?
Broadly speaking, GDP has four engines of growth in any economy.
In India’s case, the biggest engine is private consumption demand from individuals — the money spent by people in their private capacity. This demand typically accounts for 56% of all GDP and is technically called the “Private Final Consumption Expenditure” or PFCE.
The second-biggest engine is the money spent by companies and government towards making investments such as building a new office, buying a new computer or building a new road etc. This type of expenditure or “demand” accounts for 32% of all GDP in India; and is technically called Gross Fixed Capital Formation or GFCF.
The third engine is the money spent by the government towards its day-to-day expenses such as paying salaries. This accounts for 11% of India’s GDP, and is called “Government Final Consumption Expenditure (GFCE)”.
The fourth engine is demand from“Net Exports” (NX). This is the money spent by Indians on foreign goods (that is, imports) subtracted from the money spent by foreigners on Indian goods (exports). Since in most years India imports more than it exports, the NX is the smallest engine of GDP growth and is often negative. It is for this reason that NX will be excluded from the rest of the analysis.
So, GDP = PFCE + GFCF + GFCE + NX
As Table 1 shows, while all components have gone past the pre-Covid level, the recovery is dissimilar. In fact, in percentage terms, the recovery is the opposite of the relative importance of the different types of demands.
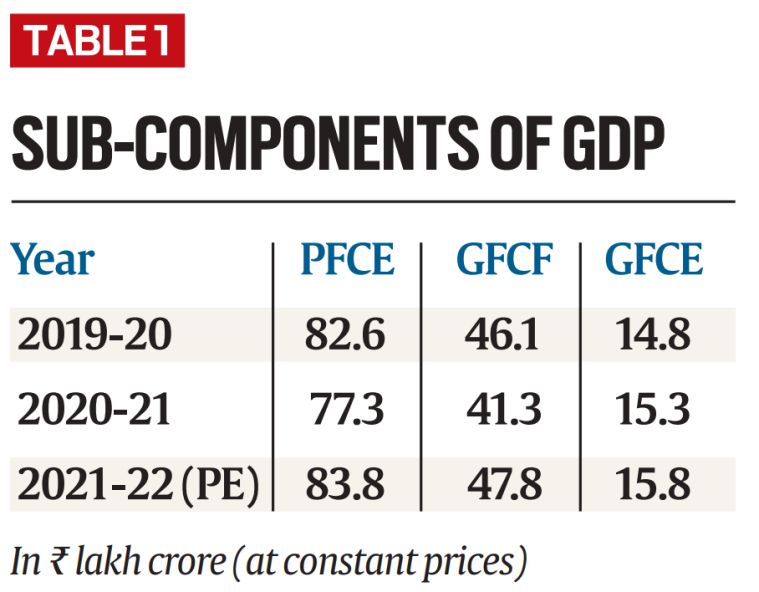 Sub-components of GDP (Source: MoSPI)
So, while the government’s expenditures are more than 6% higher than FY20 levels, investments (with three times the weight) are up less than 4% and private demand (five times the weight) is just 1.4% above the FY20 level.
What do the GVA data show?
Overall GVA was almost 3% more than the FY20 level.
As Table 2 shows, while all sectors show an increase over FY21, different sectors of the economy tell a different story. Agriculture and allied sectors, for instance, never contracted and continued to grow through the last two years. At the end of FY22, it was 6.5% higher than the pre-Covid level.
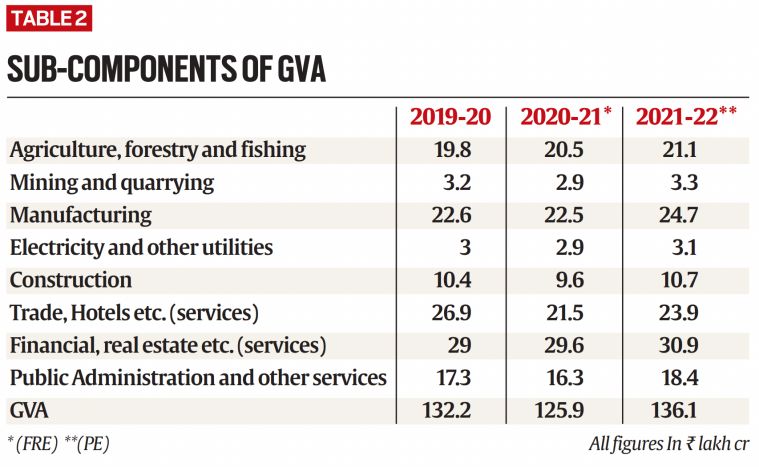 Sub-components of GVA. (Source: MoSPI)
Manufacturing is up over 9% from pre-Covid levels. But there are other sectors (such as mining and construction) that either show a moderate increase or a deficit — contact-intensive services such as trade and hotel etc. are still more than 11% below pre-Covid levels.
What is the takeaway?
It is a matter of relief that India’s economy has, at least on aggregate parameters, gone past pre-Covid levels. However, this recovery is neither uniform nor broad-based, and has created its own set of winners and losers.
This so-called “K-shaped” recovery — or growing inequality in the economy — is best captured by Chart 2. It shows that even though at the aggregate level both GDP (national income) and PFCE (expenditure) have crossed the pre-Covid level, the average Indian hasn’t yet recovered.
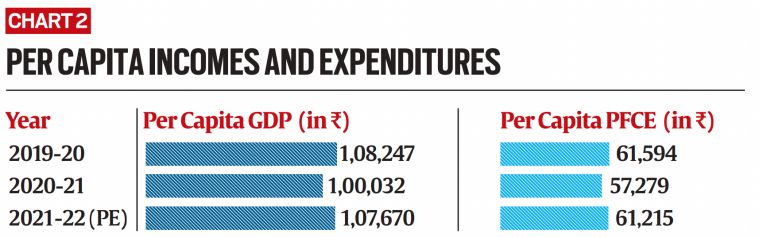 Per capita incomes and expenditures (Source: MoSPI)
The second point to remember is that this is a “recovery” only when compared to the pre-Covid level — and not to what would be the pre-Covid growth trajectory. According to the RBI, getting back to the pre-Covid trajectory will take India up to 2034-35 and that too is preconditioned on an annual economic growth rate of 7.5%.
Lastly, when it comes to future growth, the outlook is sobering. Growing geopolitical uncertainties, rising crude oil prices (and inflation), tightening of monetary conditions (higher interest rates) etc. are likely to dampen the anaemic growth private consumption demand and thus rein in growth prospects in the current (FY23) and the coming (FY24) fiscals.

As Lok Sabha polls begin, it’s over to the youngSubscriber Only

'Only Modi can shoulder task of PM for third term':Subscriber Only
UPSC Key | Coral bleaching, Indelible ink, and moreSubscriber Only

I met nobody in rural India who saw Modi asSubscriber Only

'7% is not an adequate growth rate, India ought toSubscriber Only

How Bengaluru’s lakes disappearedSubscriber Only

Lakshya Sen and Priyanshu Rajawat hold the key to India'sSubscriber Only