


Abstract
We give an overview and describe the rationale, methods, and first results from NIRCam images of the JWST "Prime Extragalactic Areas for Reionization and Lensing Science" (PEARLS) project. PEARLS uses up to eight NIRCam filters to survey several prime extragalactic survey areas: two fields at the North Ecliptic Pole (NEP); seven gravitationally lensing clusters; two high redshift protoclusters; and the iconic backlit VV 191 galaxy system to map its dust attenuation. PEARLS also includes NIRISS spectra for one of the NEP fields and NIRSpec spectra of two high-redshift quasars. The main goal of PEARLS is to study the epoch of galaxy assembly, active galactic nucleus (AGN) growth, and First Light. Five fields—the JWST NEP Time-Domain Field (TDF), IRAC Dark Field, and three lensing clusters—will be observed in up to four epochs over a year. The cadence and sensitivity of the imaging data are ideally suited to find faint variable objects such as weak AGN, high-redshift supernovae, and cluster caustic transits. Both NEP fields have sightlines through our Galaxy, providing significant numbers of very faint brown dwarfs whose proper motions can be studied. Observations from the first spoke in the NEP TDF are public. This paper presents our first PEARLS observations, their NIRCam data reduction and analysis, our first object catalogs, the 0.9–4.5 μm galaxy counts and Integrated Galaxy Light. We assess the JWST sky brightness in 13 NIRCam filters, yielding our first constraints to diffuse light at 0.9–4.5 μm. PEARLS is designed to be of lasting benefit to the community.
Export citation and abstract BibTeX RIS

Original content from this work may be used under the terms of the Creative Commons Attribution 4.0 licence. Any further distribution of this work must maintain attribution to the author(s) and the title of the work, journal citation and DOI.
1. Introduction
JWST was designed in the 1990s and 2000s to observe very faint objects at near- and mid-infrared wavelengths from the Sun–Earth L2 Lagrange point (e.g., Rieke et al. 2005; Gardner et al. 2006; Windhorst et al. 2008; Beichman et al. 2012). With its 6.5 m aperture and state-of-the-art scientific instruments, 52 JWST builds on the scientific results from two of NASA's previous flagship missions: the Hubble Space Telescope (HST; for a review of 27 yr of HST imaging data, see, e.g., Windhorst et al. 2022) and the Spitzer Space Telescope (e.g., Werner et al.2004, 2022; Soifer et al. 2008). The NASA/ESA/CSA JWST was successfully launched on 2021 December 25 on an Ariane V launch vehicle into a direct-insertion trajectory to L2. JWST was subsequently deployed, cooled to its intended cryogenic temperatures behind its giant sunshield, 53 and its instruments were successfully commissioned and calibrated (e.g., Rigby et al. 2022). 54 In its 96 minutes low-Earth orbit (LEO), the HST has experienced over 175,000 sunrises and sunsets since its launch on 1990 April 24. This, for instance, leads to HST's "orbital breathing" and time-dependent point-spread functions (PSFs; e.g., Mechtley et al. 2012, 2016; Marshall et al. 2020, 2021), as well as its significant orbital-phase-dependent sky surface-brightness (sky-SB) levels (e.g., Carleton et al. 2022; Windhorst et al. 2022). In contrast, JWST was designed to have exactly one sunrise and one sunset during its planned 10+ yr mission: its one and only sunrise occurred when the Ariane launch fairing opened on 2021 Christmas Day, and its one-and-only sunset came when its sunshield fully deployed in early 2022 January. Compared to HST, JWST will have more stable PSFs and foreground sky-SB levels, which depend primarily on its component temperatures and its pointing direction (pitch angle), respectively. The resulting very dark and stable L2 environment makes JWST particularly suited for faint-object detection in the observatory's 0.6–29 μm wavelength range, as well as assessing its sky-SB, which the "Prime Extragalactic Areas for Reionization and Lensing Science" (PEARLS) project will pursue at 0.9–4.5 μm.
From the start of observatory design in the early 2000s, JWST had four main science themes that drove its performance requirements: First Light and Reionization, Assembly of Galaxies, Birth of Stars and Protoplanetary Systems, and Planetary Systems and Origins of Life (e.g., Gardner et al. 2006). Now almost twenty years later, these remain key research areas with major unknowns, and these themes are reflected in the Cycle 1 proposals from the astronomical community and in the observing time granted. 55 As part of the science planning of JWST, R. Windhorst was chosen as a JWST Interdisciplinary Scientist in 2002 June. His 20+ yr effort and commitment comes with 110 hr of Guaranteed Time Observations (GTO). This paper gives an overview and describes the rationale, methods, and first scientific results of our project PEARLS.
PEARLS' main science goals address JWST's first two themes: First Light and Reionization and Assembly of Galaxies, including supermassive black hole (SMBH) growth. Specifically, PEARLS will observe three "blank" fields, seven galaxy clusters that show strong gravitational lensing, two high-redshift proto-clusters, two high-redshift quasars, and one nearby spiral galaxy backlit by a neighboring elliptical galaxy. Two of the blank fields are especially suited for time-domain science (e.g., Jansen & Windhorst 2018; Yan et al. 2018). These reside in program PID 2738 (PIs R. Windhorst and H. Hammel). All other PEARLS observations reside in PID 1176 (PI Windhorst). In collaboration with GTO programs by Wilmott & the NIRISS GTO team (2022; PID 1208) and Stiavelli (2022; PID 1199), two of the lensing clusters (MACS0416 and MACS1149) will have a significant additional time baseline to search for caustic transits of stars at redshifts z ≳ 1 (e.g., Diego et al. 2018; Kelly et al. 2018; Chen et al. 2022) or even individual highly magnified stars or stellar-mass black hole accretion disks at z ≳ 6 (e.g., Windhorst et al. 2018; Meena et al. 2022; Welch et al. 2022a, 2022b).
Section 2 of this paper describes the PEARLS rationale and target selection along with the planning and scheduling of the JWST observations. Section 3 describes the first PEARLS JWST/NIRCam data and their initial calibration. Section 4 presents the NIRCam catalogs of the first PEARLS blank-field survey including their completeness, the star–galaxy classification procedure, and the object counts in broadband filters covering 0.9–4.5 μm. Section 5 describes the detected and extrapolated integrated galaxy light (IGL) as derived from the 0.9–4.5 μm galaxy counts, and analyses the JWST sky-SB in 13 NIRCam filters to assess what is required to set limits to diffuse light, including any diffuse extragalactic background light (EBL). Section 6 discusses the significance of our early PEARLS results, and Section 7 summarizes our results and future prospects. PEARLS is designed to be of lasting benefit to the community, and we hope that it will catalyze a variety of multiwavelength studies during the lifetime of JWST.
This paper uses Planck cosmology (Planck Collaboration et al. 2020): H0 = 67.4 ± 0.5 km s−1 Mpc−1, matter density parameter ΩM = 0.315 ± 0.007 and vacuum energy density ΩΛ = 0.685. These give the universe an age of 13.8 Gyr. To compare our NIRCam results to decades of previous work, our object fluxes are in AB units 56 (Oke & Gunn 1983). Surface brightness (SB) values are in units of AB-mag arcsec−2 or in MJy sr−1. 57
2. PEARLS Rationale
2.1. PEARLS Science Objectives
PEARLS targets for First Light and Reionization studies include high-redshift Lyα galaxies and protoclusters. In light of observations with HST WFC3 over the past 13 yr, PEARLS will also image several rich galaxy clusters that boost the signal of faint, high-redshift objects via strong gravitational lensing. Blank-field surveys will contribute to the First Light theme via number counts. To study the Assembly of Galaxies, we will observe galaxies up to the highest redshifts, and lowest masses and luminosities, in different environments. We will also investigate SMBH growth by observing high-redshift galaxies having an active nucleus: quasars and radio galaxies. The blank fields at high Ecliptic latitude will contribute time-domain information. PEARLS will also study VV 191, a nearby, overlapping galaxy pair, to provide a benchmark dust-attenuation profile for studying high-redshift, dusty environments. Table 1 summarizes the PEARLS fields observed thus far (as of 2022 July 31), and Table 2 the PEARLS fields to be observed subsequently. The 112.3 calendar hours allocated to PEARLS include 2.3 hr from H. Hammel. In all, PEARLS will image 16 NIRCam and four NIRISS fields in up to eight filters to AB ≲ 28.5–29 mag and will cover ∼165.66 arcmin2 or 0.046 deg2, equivalent to ∼34 HUDF/XDF fields (e.g., Beckwith et al. 2006; Koekemoer et al. 2013).
Table 1. PEARLS Targets with NIRCam Images Taken as of 2022 July: Depth from ETC, SourceExtractor and Galaxy Counts
| Instr.+Filters | R.A. (J2000) | Decl. | Obs. Date | Visit | Area | SCeff | Net | Net texp (s) | |||||||
|---|---|---|---|---|---|---|---|---|---|---|---|---|---|---|---|
| Target | (h m s.sss) | (° ' '') | YYYY-MM-DD | No. | (') × (') | (%) | (hr) | 5σ Point-source AB Limit | |||||||
| NIRCam Broadband: | F090W | F115W | F150W | F200W | F277W | F356W | F410M | F444W | |||||||
| VV191-Backlit | 13 48 22.0990 | +25 40 40.01 | 2022-07-02 | 341.1 | 2.15 × 4.30 | 32.0 | 0.52 | 0934 | ⋯ | 0934 | ⋯ | ⋯ | 0934 | ⋯ | 0934 |
| PSF-FWHM (") | 0.066 | ⋯ | 0.068 | ⋯ | ⋯ | 0.164 | ⋯ | 0.163 | |||||||
ETC 5 AB lim AB lim | 27.62 | ⋯ | 28.01 | ⋯ | ⋯ | 28.00 | ⋯ | 27.59 | |||||||
Cat 5 AB lim AB lim | 27.88 | ⋯ | 28.24 | ⋯ | ⋯ | 29.01 | ⋯ | 28.81 | |||||||
| Counts 80% compl | 27.3 | ⋯ | 27.6 | ⋯ | ⋯ | 28.5 | ⋯ | 28.3 | |||||||
 AB lim(80%-ETC) AB lim(80%-ETC) | −0.3 | ⋯ | −0.4 | ⋯ | ⋯ | +0.5 | ⋯ | +0.7 | |||||||
| IRAC-Dark-ep1 | 17 40 08.5352 | +68 58 27.00 | 2022-07-08 | 121.1 | 2.15 × 4.30 | 61.2 | 1.76 | ⋯ | ⋯ | 3157 | 3157 | ⋯ | 3157 | ⋯ | 3157 |
| PSF-FWHM (") | ⋯ | ⋯ | 0.063 | 0.075 | ⋯ | 0.166 | ⋯ | 0.164 | |||||||
ETC 5 AB lim AB lim | ⋯ | ⋯ | 28.96 | 29.13 | ⋯ | 28.81 | ⋯ | 28.41 | |||||||
Cat 5 AB lim AB lim | ⋯ | ⋯ | 28.75 | 28.93 | ⋯ | 29.67 | ⋯ | 29.43 | |||||||
| Counts 80% compl | ⋯ | ⋯ | 28.1 | 28.2 | ⋯ | 29.0 | ⋯ | 29.0 | |||||||
 AB lim(80%-ETC) AB lim(80%-ETC) | ⋯ | ⋯ | −0.9 | −0.9 | ⋯ | +0.2 | ⋯ | +0.6 | |||||||
| El-Gordo | 01 02 55.4000 | −49 15 38.00 | 2022-07-29 | 241.1 | 2.15 × 4.30 | 57.3 | 2.50 | 2491 | 2491 | 1890 | 2104 | 2104 | 1890 | 2491 | 2491 |
| PSF-FWHM (") | 0.062 | 0.057 | 0.062 | 0.074 | 0.119 | 0.171 | 0.153 | 0.160 | |||||||
ETC 5 AB lim AB lim | 28.43 | 28.61 | 28.60 | 28.88 | 28.58 | 28.55 | 28.03 | 28.32 | |||||||
Cat 5 AB lim AB lim | 28.57 | 28.69 | 28.57 | 28.87 | 29.43 | 29.55 | 29.06 | 29.30 | |||||||
| Counts 80% compl | 27.9 | 27.9 | 27.7 | 28.1 | 28.8 | 28.9 | 28.1 | 28.9 | |||||||
 AB lim(80%-ETC) AB lim(80%-ETC) | −0.5 | −0.7 | −0.9 | −0.8 | +0.2 | +0.4 | +0.1 | +0.6 | |||||||
| NIRCam Medium-band: | F115W | F150W | F182M | F210M | F300M | F335M | F360M | F444W | |||||||
| TNJ1338-1942 | 13 38 26.1000 | −19 42 28.00 | 2022-07-01 | 361.1 | 2.15 × 4.30 | 37.9 | 0.86 | ⋯ | 1031 | 1031 | 1031 | 1031 | 1031 | 1031 | ⋯ |
| PSF-FWHM (") | ⋯ | 0.064 | 0.071 | 0.079 | 0.125 | 0.169 | 0.160 | ⋯ | |||||||
ETC 5 AB lim AB lim | ⋯ | 27.86 | 27.51 | 27.30 | 27.15 | 27.25 | 27.28 | ⋯ | |||||||
Cat 5 AB lim AB lim | ⋯ | 27.7 | 27.4 | 27.2 | 28.35 | 28.25 | 28.16 | ⋯ | |||||||
| Counts 80% compl | ⋯ | 27.1 | 26.6 | 26.4 | 27.8 | 27.4 | 27.3 | ⋯ | |||||||
 AB lim(80%-ETC) AB lim(80%-ETC) | ⋯ | −0.8 | −0.9 | −0.9 | +0.7 | +0.2 | +0.0 | ⋯ | |||||||
Note. For each object, line 1 lists the J2000 (R.A., decl.) tangent point to which the images were drizzled, the observing date, the APT visit number, the area covered, the net exposure time per filter and the net total hours per visit, as well as the visit's spacecraft efficiency. Line 2 lists for each filter the stellar PSF-FWHM in arcsec as measured from unsaturated stars in the drizzled images. Line 3 lists the 5σ point source sensitivity in AB-mag predicted by the prelaunch ETC for the net integration time on the first line of each target. NIRCam ETC Parameters used were aperture radii r = 0 08 for SW and r = 016 for LW, and sky annuli r = 03–099 for SW and r = 06–198 for LW. Line 4 lists the 5σ detection limit derived from the AB level in Figures 4–6 where the median SourceExtractor catalog flux error is 0.20 mag. Line 5 indicates the AB level in Figures 4–8 where the galaxy counts are ∼80% complete compared to a power-law extrapolation. Line 6 indicates the difference between the 80% galaxy count and predicted ETC 5σ point-source completeness limits in AB-mag. All PEARLS NIRCam images have a zero-point of 28.0865 to convert the flux (in MJy sr−1) in each drizzled 00300 pixel to AB-mag.
Download table as: ASCIITypeset image
Table 2. PEARLS Targets, Area Covered, Exposure Times, and Depth per Image or Grism: NIRCam, NIRISS, NIRSpec Data to be taken
| Instr.+Filters | R.A. (J2000) | Decl. | Obs. Date | Visit | Area | SCeff | Net | Net texp (s) | |||||||
|---|---|---|---|---|---|---|---|---|---|---|---|---|---|---|---|
| Target | (h m s.sss) | (° ' '') | YYYY-MM-DD | No. | (') × (') | (%) | (hr) | 5σ Point-source AB Limit | |||||||
| NIRCam Broadband: | F090W | F115W | F150W | F200W | F277W | F356W | F410M | F444W | |||||||
| IRAC-Dark-ep2 | 17 40 08.535 | +68 58 27.00 | 2023-01-05 | 121.2 | 2.15 × 4.30 | 53.9 | 1.76 | ⋯ | ⋯ | 2512 | 2512 | ⋯ | 2512 | ⋯ | 2512 |
| ⋯ | ⋯ | 28.75 | 28.93 | ⋯ | 28.64 | ⋯ | 28.23 | ||||||||
| IRAC-Dark-ep3 | 17 40 08.535 | +68 58 27.00 | 2023-07-01 | 121.3 | 2.15 × 4.30 | 53.9 | 1.76 | ⋯ | ⋯ | 2835 | 2835 | ⋯ | 2835 | ⋯ | 2835 |
| ⋯ | ⋯ | 28.87 | 29.04 | ⋯ | 28.74 | ⋯ | 28.34 | ||||||||
| NEP-TDF-ep1 | 17 22 47.896 | +65 49 21.54 | 2023-05-21 | 111.1 | 2.15 × 6.36 | 64.9 | 3.49 | 2920 | 2920 | 3350 | 3350 | 3350 | 3350 | 2920 | 2920 |
| 28.61 | 28.77 | 28.91 | 29.09 | 28.81 | 28.82 | 28.07 | 28.35 | ||||||||
| NEP-TDF-ep2 | 17 22 47.896 | +65 49 21.54 | 2022-08-26 | 112.1 | 2.15 × 6.36 | 64.9 | 3.49 | 2920 | 2920 | 3350 | 3350 | 3350 | 3350 | 2920 | 2920 |
| 28.64 | 28.80 | 28.94 | 29.11 | 28.84 | 28.84 | 28.09 | 28.37 | ||||||||
| NEP-TDF-ep3 | 17 22 47.896 | +65 49 21.54 | 2022-11-22 | 113.1 | 2.15 × 6.36 | 64.9 | 3.49 | 2920 | 2920 | 3350 | 3350 | 3350 | 3350 | 2920 | 2920 |
| 28.62 | 28.78 | 28.92 | 29.10 | 28.82 | 28.82 | 28.05 | 28.31 | ||||||||
| NEP-TDF-ep4 | 17 22 47.896 | +65 49 21.54 | 2023-02-18 | 114.1 | 2.15 × 6.36 | 64.9 | 3.49 | 2920 | 2920 | 3350 | 3350 | 3350 | 3350 | 2920 | 2920 |
| 28.60 | 28.76 | 28.91 | 29.09 | 28.81 | 28.81 | 28.04 | 28.30 | ||||||||
| WFC3-ERS-Field | 03 32 42.397 | −27 42 07.93 | 2023-07-29 | 131.1 | 2.15 × 4.30 | 63.3 | 3.48 | 3779 | 3779 | 2491 | 2491 | 2491 | 2491 | 3779 | 3779 |
| 28.63 | 28.81 | 28.74 | 28.92 | 28.58 | 28.57 | 28.07 | 28.29 | ||||||||
| MACS0416-24-ep1 | 04 16 08.900 | −24 04 28.70 | 2022-09-26 | 211.1 | 2.15 × 4.30 | 64.4 | 3.72 | 3779 | 3779 | 2920 | 2920 | 2920 | 2920 | 3779 | 3779 |
| 28.70 | 28.87 | 28.91 | 29.10 | 28.74 | 28.77 | 28.24 | 28.50 | ||||||||
| MACS0416-24-ep2 | 04 16 08.900 | −24 04 28.70 | 2022-12-10 | 212.1 | 2.15 × 4.30 | 64.4 | 3.72 | 3779 | 3779 | 2920 | 2920 | 2920 | 2920 | 3779 | 3779 |
| 28.72 | 28.89 | 28.93 | 29.13 | 28.78 | 28.82 | 28.29 | 28.57 | ||||||||
| MACS0416-24-ep3 | 04 16 08.900 | −24 04 28.70 | 2023-09-26 | 213.1 | 2.15 × 4.30 | 63.9 | 3.61 | 3779 | 3350 | 2920 | 2920 | 2920 | 2920 | 3350 | 3779 |
| 28.70 | 28.80 | 28.91 | 29.10 | 28.74 | 28.77 | 28.17 | 28.50 | ||||||||
| Abell 2744 | 00 14 21.200 | −30 23 50.10 | 2023-07-29 | 221.1 | 2.15 × 4.30 | 62.1 | 3.25 | 3350 | 3350 | 2491 | 2491 | 2491 | 2491 | 3350 | 3350 |
| 28.53 | 28.71 | 28.72 | 28.92 | 28.60 | 28.66 | 28.17 | 28.45 | ||||||||
| MACS1149+22 | 11 49 36.400 | +22 23 59.00 | 2024-01-23 | 231.1 | 2.15 × 4.30 | 66.4 | 3.25 | 3350 | 3350 | 2491 | 2491 | 2491 | 2491 | 3350 | 3350 |
| 28.47 | 28.66 | 28.68 | 28.88 | 28.56 | 28.62 | 28.13 | 28.40 | ||||||||
| PLCK-G165.7+67 | 11 27 15.000 | +42 28 31.00 | 2023-03-25 | 251.1 | 2.15 × 4.30 | 57.3 | 2.50 | 2491 | 2491 | 1890 | 2104 | 2104 | 1890 | 2491 | 2491 |
| 28.38 | 28.56 | 28.57 | 28.85 | 28.55 | 28.54 | 28.03 | 28.34 | ||||||||
| Clio | 08 42 20.893 | +01 38 32.66 | 2023-03-17 | 261.1 | 2.15 × 4.30 | 52.9 | 1.74 | 2491 | ⋯ | 1890 | 1890 | 1890 | 1890 | ⋯ | 2491 |
| 28.30 | ⋯ | 28.48 | 28.67 | 28.36 | 28.43 | ⋯ | 28.27 | ||||||||
| RXC-J1212+27 | 12 12 19.250 | +27 33 08.70 | 2023-01-01 | 271.1 | 2.15 × 4.30 | 52.9 | 1.74 | 2491 | ⋯ | 1890 | 1890 | 1890 | 1890 | ⋯ | 2491 |
| 28.32 | ⋯ | 28.51 | 28.70 | 28.41 | 28.43 | ⋯ | 28.14 | ||||||||
| PLCK-G191.24+62 | 10 44 42.600 | +33 50 53.40 | 2023-04-03 | 281.1 | 2.15 × 4.30 | 57.3 | 2.50 | 2491 | 2491 | 1890 | 2104 | 2104 | 1890 | 2491 | 2491 |
| 28.32 | 28.50 | 28.51 | 28.79 | 28.49 | 28.49 | 27.99 | 28.29 | ||||||||
| NIRISS Grism: | G150C | G150R | F200W | ||||||||||||
| NEP-TDF-ep1 | 17 22 47.896 | +65 49 21.54 | 2023-05-21 | 111.2 | 2.22 × 4.90 | 58.7 | 3.49 | 2835 | 2835 | 6456 | |||||
| 25.86 | 25.86 | 29.53 | |||||||||||||
| NEP-TDF-ep2 | 17 22 47.896 | +65 49 21.54 | 2022-08-23 | 112.2 | 2.22 × 4.90 | 58.7 | 3.49 | 2835 | 2835 | 6456 | |||||
| 25.86 | 25.86 | 29.53 | |||||||||||||
| NEP-TDF-ep3 | 17 22 47.896 | +65 49 21.54 | 2022-11-22 | 113.2 | 2.22 × 4.90 | 58.7 | 3.49 | 2835 | 2835 | 6456 | |||||
| 25.86 | 25.86 | 29.53 | |||||||||||||
| NEP-TDF-ep4 | 17 22 47.896 | +65 49 21.54 | 2023-02-18 | 114.2 | 2.22 × 4.90 | 58.7 | 3.49 | 2835 | 2835 | 6456 | |||||
| 25.86 | 25.86 | 29.53 | |||||||||||||
| NIRSpec prism: | PRISM | ||||||||||||||
| NDWFS1425+3254 | 14 25 16.408 | +32 54 09.58 | 2023-04-27 | 311.1 | 0.10 × 0.10 | 39.9 | 1.14 | 4202 | |||||||
| 26.25 | |||||||||||||||
| SDSSJ0005-0006 | 00 05 52.340 | -00 06 56.86 | 2023-07-10 | 321.1 | 0.10 × 0.10 | 39.9 | 1.14 | 4202 | |||||||
| 26.05 | |||||||||||||||
| Total PEARLS | 165.66 (')2 | 59.5 | 68.9 | ||||||||||||
Note. As for Table 1. Obs. Date is the earliest observation date in the long range plan (LRP) windows on the STSCI website. For the two NIRISS grisms G150C and G150R we list the 1σ continuum sensitivity for unbinned spectral pixels. For the IFU PRISM observations the NIRSpec ETC suggests a 5σ sensitivity at 2 μm for unresolved emission lines with a line flux of ∼1.2 × 10⁻¹⁷ erg cm−2 s−1, and a 2σ sensitivity at 2 μm for a continuum source of (9–10)× 10−21 erg cm−2 s−1 (or AB ≃ 26.05–26.25 continuum mag at 1.5 μm). The totals on the bottom line indicate the total area, spacecraft efficiency, and net observing hours for the entire PEARLS GTO program 1176+2738.
PEARLS will obtain data over at least 13 independent lines of sight more than three degrees apart from each other and is therefore more robust against cosmic variance (CV) at AB ≲ 28.5 mag than programs that image only a few areas (e.g., Somerville et al. 2004; Driver & Robotham 2010; Windhorst et al. 2022). Figure 1 compares the area and depth covered by PEARLS to other JWST Cycle 1 surveys. While not as deep or wide as other contiguous JWST Cycle 1 surveys, PEARLS covers more fields across the sky to decrease the effects of CV. The expected CV for PEARLS fields can be found with the calculator 58 of Driver & Robotham (2010) based on the areas covered and sensitivity limits in Tables 1 and 2. To AB ≲ 28.5 mag, the PEARLS fields sample a typical redshift range of z ≃ 0.3–8 with a median redshift of z ≃ 1–2 (see Section 4.5 and Appendix B.2). The NIRCam field of view (FOV) covers ∼0.0026 deg2 (Section 3.1 or ∼1.1 × 2.2 Mpc), over which its CV is then predicted to be 30%. For the two PEARLS fields with galaxy counts presented here in Section 4.5, CV is expected to be ≲9%. At the end of JWST Cycle 1, large JWST NIRCam parallel programs like PANORAMIC (PID 2514; C. Williams PI) may push CV of the sampled objects to ∼1%–2%.
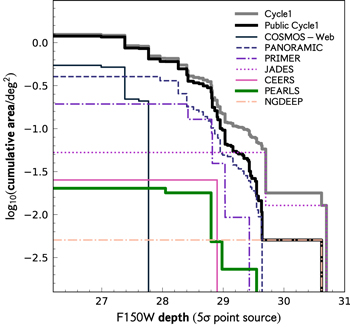
Figure 1. Summary of the area and depth covered by JWST Cycle 1 surveys 59 . Colors and line types identify seven GO and GTO surveys as shown in the legend, and the order in the legend matches the maximum survey area as shown along the left ordinate. The thick black line shows the total area–depth of all public Cycle 1 surveys, and the thick gray line shows the same including surveys with proprietary data. The thick green line indicates PEARLS, which combines a smaller area of significant depth with a much larger area of 16 shallower fields to significantly average over CV (Sections 2 and 4.5), and include seven lensing clusters.
Download figure:
Standard image High-resolution imageIn four of our NIRCam pointings, coordinated NIRISS grism and imaging parallels will cover a significant portion of our NIRCam images (Table 2), while UV-optical images are available from HST WFC3+ACS. The coordinated NIRISS parallels will be used for both object characterization and redshifts, and to expand the area and time-baseline of time-domain studies. The coordinated parallel observations are critical to obtain imaging and grism data that is as homogeneous as possible, over as large an area as possible, and in the least amount of time feasible with JWST.
Two of the PEARLS blank fields and two galaxy cluster fields will be observed more than once. This time-domain component will allow us to find and study Galactic brown dwarfs via high proper motion or atmospheric variability, variable active galactic nuclei (AGN), high-redshift supernovae, and any time-varying objects seen behind lensing clusters, including possible cluster caustic transits. The PEARLS time-domain data at the North Ecliptic Pole (NEP) may also reveal some faint moving objects at high Ecliptic latitude in our outer solar system.
To encourage immediate use of JWST data by the community and follow-up proposals by JWST Cycle 2 GO proposers, we will make the first epoch of our JWST NEP Time-Domain Field (TDF) public immediately (#112.* in Table 2). The other three JWST NEP TDF epochs will be released together with the v1 data products as soon as we have these. Also public right away are the Cycle 25 (R. Jansen et al. 2022, in preparation), 28, and 29 HST WFC3/UVIS F275W and ACS/WFC F435W+F606W observations of the NEP TDF and other ancillary data across the electromagnetic spectrum, as these become available and their data reduction is completed. These include 600 ks NuSTAR 3–24 keV images (Zhao et al. 2021; F. Civano et al. 2022, in preparation), 900 ks of Chandra ACIS 0.2–10 keV images (P. Maksym et al. 2022, in preparation), 31 hr of JCMT/SCUBA-2 plus 66 hr of SMA data at 0.85 mm, as well as 70 hr of VLA 3 GHz A+B-array images (M. Hyun et al. 2022, in preparation), 147 hr of VLBA 4.5 GHz data at milliarcsec (mas) resolution to sub-micro-Jy levels, and 75 hr of LOFAR 150 MHz images including LOFAR VLBI. The presence of a S3 GHz ≃ 239 mJy quasar at z = 1.4429 in the JWST NEP TDF that is unresolved at VLBI milliarcsecond resolution is used as phase calibrator to provide high resolution VLA/VLBA and LOFAR/VLBI images of very high dynamic range in the NEP TDF. The NEP TDF database also includes multi-epoch Large Binocular Telescope/LBC + Subaru/HSC Ugiz images to AB ≲ 26.0 mag, Gran Telescopio Canarias/HiPERCAM ugriz images to AB ≲ 27 mag, Multiple Mirror Telescope/MMIRS images to YJHK ≲ 24–23 mag, and MMT/Binospec and MMIRS spectra to 22–24 mag (C. Willmer et al. 2022, in preparation), plus JPAS 56-narrow-band spectrophotometry to provide confirmation of the astrometric, photometric, and spectroscopic calibration of our JWST NIRCam+NIRISS observations.
2.2. PEARLS Target Selection
PEARLS target selection began in the early 2010s, when it became clear that JWST had a viable path toward launch and that it could perform as designed. The largest blank field is in the JWST continuous viewing zone (CVZ) near the NEP. This NEP TDF has the best combination of low foreground extinction and absence of AB ≲ 16 mag stars (Jansen & Windhorst 2018). A second blank field is within the IRAC Dark Field, which is a Spitzer/IRAC calibration field near the NEP observed repeatedly for over 15 yr. These historical light curves offer several examples of what might be high-redshift, dusty supernovae in ultraluminous infrared galaxies selected by Herschel (Yan et al. 2018). Figures 1(a) and 2(a) of Jansen & Windhorst (2018) give a layout of the JWST CVZ in the NEP, where the IRAC Dark Field (IDF) is ∼3 56 NE of the TDF. Our Figure 2 shows the first-epoch NIRCam observation of the JWST IDF (hereafter the JWIDF). The final blank field is in the WFC3 ERS area (Windhorst et al. 2011), which is in the northern part of the GOODS-South area.
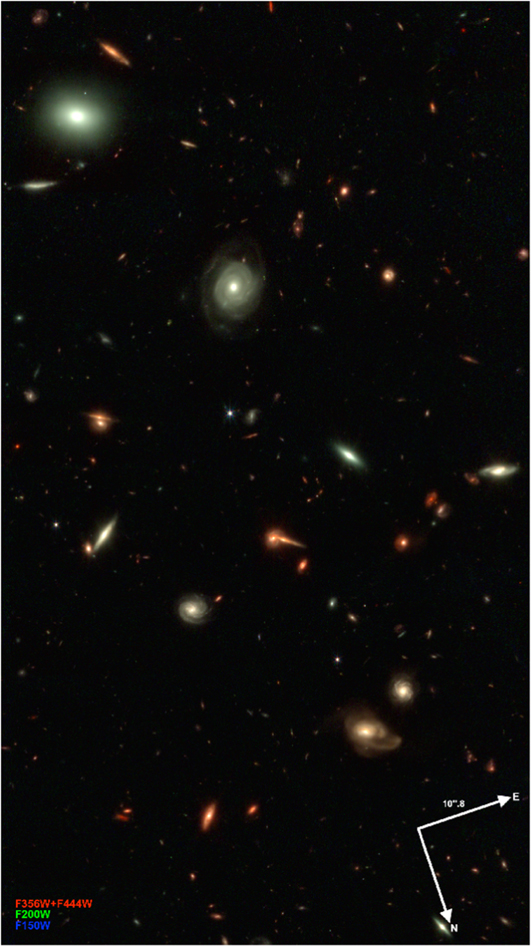
Figure 2. PEARLS NIRCam image of the IRAC Dark Field (JWIDF) Epoch-1 at the north Ecliptic pole. Filter F150W is rendered as blue, F200W as green, and F356W+F444W as red using a log scaling (e.g., Lupton et al. 2004; Coe 2015). This 2040 × 3644 pixel section covers 612 × 1093, and image orientation is shown by the labeled arrows. Areas with remaining wisps and snowball imprints were masked before making object catalogs and counts. (Please magnify all PDF images to see details.)
Download figure:
Standard image High-resolution imagePEARLS gravitational-lensing clusters were selected to have high mass and central compactness or to have apparent double-cluster nature. The latter could result in higher transverse motions and therefore makes caustic transits more likely. Possible transiting sources include distant, luminous single stars, double stars, and possibly stellar-mass black hole accretion disks (e.g., Miralda-Escude 1991). All of our selected clusters show gravitationally lensed arcs, and all have lensing magnification maps produced with multiple independent lensing models, which will be refined with the JWST data. Other lensing clusters were similarly selected because of their high mass and high central compactness, and their lower IntraCluster Light (ICL) content, which could make it easier to detect caustic transits with less microlensing by foreground stars in the cluster ICL (e.g., Windhorst et al. 2018). The PEARLS lensing clusters are:
- 1.The HFF (Lotz et al. 2017) cluster MACS J0416.1−2403 at z ≃ 0.397. This field will be covered by three JWST epochs about six months apart to maximize the chance of seeing caustic transits at z ≥ 6 (e.g., Windhorst et al. 2018; Welch et al. 2022a, 2022b). A number of plausible caustic transits at z ≃ 0.9–1.5 have already been observed for this cluster by HST (Dai et al. 2018; Kelly et al. 2018; Dai 2021).
- 2.Abell 2744 at z ≃ 0.31 and MACS J1149.5+2223 at z ≃ 0.54. These are likewise HFF (Lotz et al. 2017) clusters. They will have additional GTO observations by Wilmott & the NIRISS GTO team (2022), and by Stiavelli (2022) to look for variable objects in or behind these clusters, and by the GLASS team (PID 1324; PI: Treu et al. 2022). This allows us to monitor potential high-redshift caustic transits on timescales longer than a year.
- 3.The cluster known as El Gordo at z ≃ 0.87 (Menanteau et al. 2012; Zitrin et al. 2013; Cerny et al. 2018; Diego et al. 2020; Caputi et al. 2021). This cluster was selected because of its enormous mass (Menanteau et al. 2012, ∼2 × 10¹⁵ M⊙), its elongation to maximize the probability of caustic transits (Windhorst et al. 2018), and its rich collection of distant lensed source candidates. The field includes a background galaxy grouping at z ≃ 4.3 (Caputi et al. 2021) that is lensed by the cluster. Figure 3 shows the module around El Gordo that did not cover the central part of the cluster (hereafter referred to as the "noncluster" module; see Section 4.5).
- 4.PLCK G165.7+67.0 (G165) is a double cluster at z ≃ 0.35 selected by its FIR colors, and not by the Sunyaev–Zeldovich effect (e.g., Cañameras et al. 2015; Harrington et al. 2016; Planck Collaboration et al. 2016). Many caustic-crossing arcs are detected, which are well-suited to transient science. One example is a strongly lensed red and dusty submillimeter galaxy detected in the HST imaging, whose counter image appears in the LBT/LUCI+ARGOS laser-guided AO K-band images (e.g., Frye et al. 2019; Rabien et al. 2019). Spectral energy distributions (SEDs) fit to the optical–near-IR images yield photometric redshift estimates for some image families, which constrain the lens model (Pascale et al. 2022). The model confirms the bi-modal mass distribution of this ongoing merger that is only a low-luminosity X-ray source. The JWST observations aim to constrain the dynamical state of this cluster and detect a significant number of lensed background sources.
- 5.The Clio cluster at z ≃ 0.42 from the GAMA survey (Driver & Robotham 2010; Alpaslan et al. 2012) is a massive, compact cluster selected to have significant potential for lensing background sources. A ground-based VLT image (Griffiths et al. 2018) already showed strongly lensed arcs and a lower-than-average amount of IntraCluster Light. This is attractive because low-mass IntraCluster Medium stars can significantly lengthen caustic-transit times (e.g., Diego et al. 2018; Windhorst et al. 2018) and complicate their lensing analysis.
- 6.The cluster RXC J1212+27 = A1489 at z ≃ 0.35. This cluster was chosen because of strong gravitational lensing, using the automated implementation (Zitrin et al. 2012) of the light-traces-mass method (e.g., Zitrin & Broadhurst 2016; Zitrin 2017). HST images showed a significant number of lensed sources that resulted in a good lensing model (Zitrin et al. 2020).

Figure 3. PEARLS NIRCam image of the El Gordo module 3' away from the cluster. Filters F090W+F1115W are rendered as blue, F150W+F200W+F277W as green, and F356W+F410M+F444W as red. This El Gordo 4466 × 4424 pixel section covers 1340 × 1327, and image orientation is shown by the labeled arrows. Areas with remaining detector border effects and bright-star diffraction spikes (e.g., the blue spike from a bright star just outside the lower-left FOV) were masked before making object catalogs and counts.
Download figure:
Standard image High-resolution imageThe first public JWST images (Pontoppidan et al. 2022) released starting 2022 July 12 have already inspired a number of further studies. Relevant for PEARLS, a possible caustic transit candidate has been suggested at z ≃ 3 in some of the public JWST images of the cluster SMACS0723 (e.g., Chen et al. 2022), for which mass models were made by (e.g., Pascale et al. 2022), and in which also a significant number of red spirals were identified (e.g., Ferreira et al. 2022; Fudamoto et al. 2022). Indeed, some very high redshift candidates were already suggested in some of the very first JWST ERS images (Adams et al. 2022; Finkelstein et al. 2022). The PEARLS high redshift protoclusters are:
- 1.PHz G191.24+62.04 (G191) is a protocluster candidate at z = 2.55 with one of the highest star formation rates (SFR ≃ 23,000 M⊙ yr−1) in the parent sample of Planck high-z sources (PHz; Planck Collaboration et al. 2016). G191 hosts an overdensity of red Spitzer sources (Planck Collaboration et al. 2015; Martinache et al. 2018), containing ∼14 objects arcmin−2 with IRAC 3.6–4.5 μm colors ≳–0.1 mag. Two of the Herschel sources have spectroscopic redshifts and a large estimated SFRs ≃1000–1500 M⊙ yr−1 (Polletta et al. 2022), i.e., high enough that they present challenges for theoretical models (Granato et al. 2015; Lim et al. 2021; Gouin et al. 2022). The JWST observations will constrain the stellar mass assembly and fueling mechanism (e.g., major mergers, cold accretion) occurring in this highly star-forming high-z structure.
- 2.TNJ1338−1942 is a protocluster at z = 4.1 that was discovered with the VLT as 60 Lyα-emitters near a luminous, steep-spectrum radio source (e.g., De Breuck et al. 1999, 2000; Venemans et al. 2002; Miley et al. 2004; Intema et al. 2006; Saito et al. 2015). The radio source's AGN activity and outflow will be studied by a JWST Cycle 1 GO program (PID 1964, PI R. Overzier). PEARLS has imaged the field in the five NIRCam medium-band filters that best straddle the Balmer/4000 Å break at z = 4.1 to help delineate the ages of ∼30 of the Lyα-emitters. Figure 4 shows part of the NIRCam image around TNJ1338−1942. To maximize the scientific return on TNJ1338−1942, the analysis of the PEARLS and GO data will be coordinated.
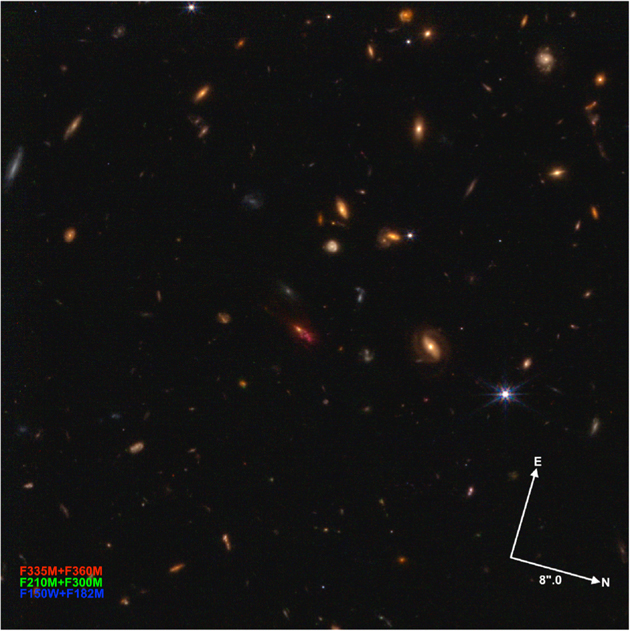
Figure 4. NIRCam image of the z = 4.1 TNJ1338 protocluster. Filters F150W+F182M are rendered as blue, F210M+F300M as green, and F335M+F360M as red. This 1850 × 1850 pixel section covers 555 × 555, and the image orientation is shown by the labeled arrows. The radio galaxy is the irregular orange object in the center.
Download figure:
Standard image High-resolution imageIn addition to our above two protocluster targets, the z ≃ 4.3 group of galaxies behind El Gordo (Caputi et al. 2021) may also turn out to be a protocluster candidate. Additional PEARLS targets are:
- 1.Two QSOs, QSO 1425+3254 (or NDWFS J142516.3+325409 at z = 5.85; e.g., Mechtley et al. 2012), and QSO J0005−0006 (or SDSS J000552.35−000655.6 at z = 5.86). The first has a number of possible z ≃ 6 companions (e.g., Marshall et al. 2020, 2021). PEARLS IFU observations will address whether these form a group around the QSO. QSO J0005−0006 was selected because it lacks both hot and cold dust (Wang et al. 2008; Jiang et al. 2010). It therefore represents a rare subpopulation of dust-free high-z quasars.
- 2.The VV 191 system (Figure 5) consists of a foreground spiral galaxy with an unassociated elliptical galaxy behind it (e.g., Keel et al. 2013). Light from the elliptical suffers extinction from dust in the spiral. PEARLS NIRCam imaging maps the extinction and determine its wavelength dependence (Keel et al. 2022).

Figure 5. PEARLS NIRCam image of the VV 191 system. Filter F150W is rendered as blue, F200W as green, and F356W+F444W as red. The elliptical galaxy VV 191a on the left backlights the spiral VV 191b on the right. Separation between the nuclei is 204, and the image orientation is shown by the labeled arrows. The orange arclet south of VV 191a is gravitationally lensed by the bright elliptical (for details, see Keel et al. 2022). Note the background objects of similar angular size but different color. This 1500 × 1500 pixel section covers 450 × 45.
Download figure:
Standard image High-resolution image2.3. PEARLS' Observation Planning
2.3.1. JWST Observation Planning of PEARLS Targets
Most PEARLS targets will be imaged with NIRCam in a set of eight broadband filters, as shown in Table 1. In a few fields, fewer filters are needed to accomplish the intended science. The NIRISS Grism mode and NIRSpec Prism mode are used in a few fields. One field (TNJ1338−1942) will be observed in five NIRCam medium-band filters and one broadband filter, as summarized in Table 2.
Four PEARLS fields have a time-domain component on timescales of hours to a year. This could reveal objects with high parallax in our solar system, Galactic brown dwarfs with high proper motion and/or atmospheric variability, variable AGN, high redshift supernovae, and caustic transits behind galaxy clusters. The two PEARLS fields at high ecliptic latitude and with multiple visits also enable searches for solar system objects in high-inclination orbits. To increase the search effectiveness, H. Hammel allocated a portion of her GTO time to the NEP observations. The combined observations make up PID 2738, which is an efficient combination of three epochs of observation in the JWIDF and four epochs in the TDF. Where possible, visits with similar orientations were combined to save JWST overhead time. The PEARLS programs 1176+2738 require 62.0 + 53.7 spacecraft hours and give 68.9 hr of net exposure time (Tables 1 and 2). The observing efficiency is therefore ∼59.5%. This is less than the maximum JWST spacecraft efficiency of ∼70% achievable for very long integrations on deep fields, but it is in line with the efficiency of JWST observations of average duration. Accepting somewhat lower efficiencies was a deliberate choice to address CV.
The PEARLS time-domain fields are:
- 1.The TDF. The field layout is four "spokes" with orientations differing by 90°. This is accomplished by observing at three-month intervals. Each spoke is a 2 × 1 mosaic of pointings with 57% overlap to fill the NIRCam inter-chip gaps of each module. At each pointing in the mosaic, four dithers fill in the gaps in the NIRCam SW detector module. All eight broadband filters are used. The TDF observations include coordinated parallel observations with NIRISS/WFSS in the orthogonal low-resolution grisms GR150C and GR150R. A broadband filter must be used simultaneously to define the sampled spectral wavelength range and so limit spectral overlap. The F200W 60 broadband filter was used for this purpose to explore a new wavelength range not sampled by the HST WFC/IR G102 or G140 grisms. The field dimensions were chosen to make the NIRISS footprints maximally overlap each NIRCam mosaic that was taken ∼183 days earlier or later, i.e., 180° different position angle (Figure 7(b) of Jansen & Windhorst 2018). The grism spectra will allow object characterization and yield redshifts, and the direct NIRISS F200W images—needed to identify which grism spectrum is which object—will give an additional 2.0 μm epoch image for time-domain studies. In order to match the number of primary and parallel exposures, the exposure time in several of the NIRCam filters is split over two observing sequences.
- 2.The JWIDF. The field covers a single rectangle of ∼5
 9 × 24. It will be observed in three epochs six months apart, giving position angles that differ by 180°, i.e., covering the same area at each epoch. A 6-point, full-box dither pattern fills both intra-module and intra-chip gaps. Four broadband filters (SW: F150W and F200W; LW: F356W and F444W) are observed. Our hope is that many future epochs will be observed in GO time to provide long-duration monitoring, including dusty high redshift supernovae in Herschel selected galaxies.
 - 3.
JWST scheduling is a complex, ongoing and constantly changing process 61 . Full details of observations are in the JWST "APT files" also available at these websites. 62
2.3.2. PEARLS' Primary NIRCam Observations and Areas
NIRCam consists of two modules A and B, each imaging two sky regions 215 × 215 in size separated by ∼07.
63
In each module, dichroics direct short-wavelength (SW; 0.6–2.3 μm) and long-wavelength (LW; 2.3–5.2 μm) light from each sky region onto corresponding detectors. The LW modules have a single detector with 2040 × 2040 illuminated pixels at a scale of 00629 per pixel. Each SW module has four detectors to cover the same sky area at 00312 per pixel. There are 45 gaps between the four SW detectors in each module. With 4-step dithering across the 45 gaps, the total area covered by each exposure is about 22 × 22 in each of the two modules or about 9.6 arcmin2 for a full all-detector exposure.
Our PEARLS NIRCam imaging uses both modules (A and B) and both detector units (SW and LW) for a total of 10 detector readouts per integration. A 4-point INTRAMODULEBOX dither pattern is used to filter out the cosmic-ray (CR) flux in JWST's L2 orbit. The on-the-ramp readout patterns are typically either MEDIUM8 with seven groups per integration or SHALLOW4 with 8–10 groups per integration, whichever produced the required sensitivity according to the NIRCam exposure time calculator (ETC).
64
For some shallower targets, a FULLBOX dither pattern was used with six primary dithers (6TIGHT) and STANDARD dither-type to cover the SW inter-chip gaps in order to make them schedulable. The resulting total net exposure times in each NIRCam filter and their ETC sensitivities are listed in Tables 1 or 2. These sensitivities will be verified with the object counts of Sections 4.4–4.5. Dither steps were made large enough to cover the small SW intra-module gaps. Most PEARLS targets are small enough to fit in the FOV of a single NIRCam module. The exceptions are the NEP TDF and the JWIDF. For those targets, dithers need to cover the 43'' inter-module gap and for the TDF also the FOV covered by the NIRISS parallels (Jansen & Windhorst 2018). This results in four NIRCam spokes 215 × 636 with a total area of 13.67 arcmin2 per spoke, and a total area for the four TDF epochs of 54.79 arcmin2 at the nominal 4-dither point depth.
2.3.3. PEARLS' Coordinated NIRISS Parallel Observations and Areas
NIRISS covers a single 133'' × 133'' FOV with 2040 × 2040 light sensitive pixels
65
at a scale of 0065 per pixel to cover an area of 4.9 arcmin2. Its wavelength coverage is 0.8–5.2 μm. The NIRISS parallels in the TDF will consist of 2 × 1 mosaics with orthogonal grisms GR150C and GR150R. Each position will include finder images in the F200W filter that are expected to reach AB ≲ 29.5 mag. Each of the dispersed NIRISS images must be bracketed by F200W images to enable source identification and wavelength calibration, so there are a total of four such direct images per pointing. The NIRISS F200W images thus 6456 s total integration time, more than the nonoverlapping outskirts of the NIRCam F200W images, and therefore may reach ∼0.4 mag deeper (Table 2).
The NIRISS grism exposures will use the readout pattern "NIS" and have typically 13 groups per integration and two integrations per exposure. By necessity, the NIRISS coordinated parallels have the same dither pattern as the NIRCam primary images, and thus NIRISS covers about 222 × 42 or 9.32 arcmin2 in each spoke. This will give 37.35 arcmin2 at the nominal four-dither depth for the four TDF epochs combined. Because of the larger NIRISS pixels, the optimal NIRCam dither pattern is not optimal for NIRISS, so the NIRCam F200W primary images will provide a better-sampled F200W image, but the very faintest objects in F200W will be detected only by NIRISS. Net exposure times in F200W and the two grisms and their ETC sensitivities are listed in Table 2.
When all four NEP TDF epochs are taken as planned, the NIRISS area of each spoke will nearly perfectly overlap with the NIRCam spoke observed ∼183 days earlier or later. Details are given in Jansen & Windhorst (2018). The resulting NIRCam spokes with total area 54.79 arcmin2 will have a depth of AB ≲ 28.5 in most filters (5σ for point sources, Table 2). NIRISS will provide R ∼ 150 spectra ranging from 1.75 to 2.22 reaching AB ≲ 25.9 mag for objects in the coverage area, which is a total of 37.35 arcmin2 when combining all four NIRISS spokes. This is the most efficient way of getting both JWST NIRCam images and NIRISS spectra of the same area.
According to the JWST ETC, typical 5σ sensitivities obtained for point sources from our shallowest (∼2 hr) to our deepest (∼6 hr) mosaics are ∼28–28.5 mag to ∼28.5–29 mag per target. According to the ETC the reddest (3–5 μm) filters may be less sensitive than the bluer (0.9–3 μm) ones in both NIRCam and NIRISS. However, as we will see in Section 4, the wider PSF of the redder filters more than compensates for any lower sensitivity in detection of very faint and slightly extended galaxies. Modest variations in sensitivity occur from field-to-field, depending on exactly how much time could be fit into the scheduled APTs for each field within our total GTO allocations, and on the actual Zodiacal-light brightness and the straylight contributions in each field (Section 5).
3. PEARLS Calibration, Mosaicing, and Data Quality
3.1. Initial Calibration
Calibration of PEARLS data obtained as of 2022 July used the calibration files on the STSCI JWST website as of 2022 July 12. All data were processed with the standard STScI pipeline CALWEBB, 66 which comes in three stages: (1) detector-level corrections to the raw individual exposures to produce count-rate images from the nondestructive readouts ("ramps"); (2) photometric and astrometric calibration of the individual exposures; and (3) drizzling the calibrated and distortion-corrected images into mosaics. The NIRCam pipeline CALWEBB was used to process all our images. The Calibration Reference Data System (CRDS) provides the latest reference files that we used to calibrate our data. 67 CRDS version 11.13.1 was used for all images.
Our NIRCam TNJ1338, VV191, and JWIDF images taken in early 2022 July were initially reduced with Pipeline version v1.6.1.dev2+g408c711 and context file jwst_0916.pmap_filters, which contained the prelaunch ZP values available then. Our more recent El Gordo images of 2022 July 29 were reduced with Pipeline version 1.6.2 in early 2022 August using context file jwst_0942.pmap_filters, which implemented Rigby et al. (2022) in-flight ZPs affecting all NIRCam filters. We refer to these calibrations and their resulting mosaics as version v0.5. When more accurate on-orbit NIRCam flat-field and ZP calibrations became available in early 2022 October, we reprocessed our PEARLS images into a version v1 with context file jwst_0995.pmap_filters and Pipeline version 1.7.2. We will make v1 of the NEP TDF available to the community as soon as its catalogs are completed and verified (R. Jansen et al. 2022, in preparation). Further details of the 2022 October calibration improvements are given in Section 3.3 and Appendix B.1.
Performance of the NIRCam detectors is relevant to depth, calibration quality, and accuracy of the sky-SB values discussed in Section 4–5. SW and LW module characteristics relevant for PEARLS are: 68
- 1.Average NIRCam read-noise values are ∼16.2 and ∼13.5 e− pixel−1 using correlated double-sampling.
- 2.Average dark-current values in typical exposures are very low: ∼0.0019 ± 0.002 and ∼0.027 ± 0.005 e− s−1.
- 3.Average detector gains are ∼2.05 and ∼1.82 e− ADU−1, respectively.
- 4.Persistence of charge from a previous equal-length exposure is ≲0.01% of the original charge detected in the previous image.
3.2. Mosaicing of the PEARLS Images
The first step in mosaicing was to anchor all individual frames into the Gaia DR3 reference frame (Gaia Collaboration et al. 2022). This step used catalogs based on recent, deep ground-based or HST images already referenced to Gaia DR3. Both stars and galaxies were used for the correction with star positions corrected for proper motion from the epoch of the reference image to the JWST observing epoch (Table 1). Coordinate differences between the catalog and JWST frame were measured, and each frame's center position and position angle were adjusted to minimize the differences. Typical adjustments were ≲10 mas, and the final uncertainty in each frame's position is about 2–3 mas rms. We used AstroDrizzle
69
(Koekemoer et al. 2013; Avila et al. 2015) to drizzle the NIRCam images as calibrated in the CALWEBB pipeline Stages 1 and 2 into two mosaics for each field. Pixel sizes used were 00300 and 00600 for SW and LW, respectively. For the LW module, we also provide 00300 pixel−1 mosaics to facilitate aligned analysis. The higher resolution of the former samples the NIRCam PSFs better in the SW channel, while the bigger pixels of the latter have better SB sensitivity for the generally short PEARLS exposures. All NIRcam images were drizzled after we removed wisps as well as possible, applied a 1/f correction, flagged the snowballs before object detection, and subtracted a surface-fit to the sky-SB between all the detected objects. Details on these aspects are given below.
3.3. First Assessment of Calibration Quality
1. NIRCam 1/f Noise Pattern Removal: NIRCam images are read out simultaneously in four vertical 510 × 2040 pixel strips. Differing gains or zero-points in the four amplifiers causes banding or striping across the images as they are read out. Rest (2014) presented a mathematical method to separate this 1/f noise from the random read noise 70 and derived the time dependence of the 1/f noise. Rest (2014) found that the 1/f noise strongly correlates between the amplifiers of a given detector because it is caused by a common reference voltage. Rest (2014) also found that the 1/f noise has reproducible spatial structure at the 10%–20% level down to spatial scales of tens of pixels, and this structure does not seem to change on timescales of months. Schlawin et al. (2020) described methods to reduce 1/f-noise patterns in the highly demanding NIRCam grism time-series observations of exoplanets. As a bonus, their spatial background subtraction also efficiently removes many random detector defects, including preamplifier offsets, amplifier discontinuities, and even–odd column offsets. The NIRCam 1/f noise can also be reduced by subtracting the values from background pixels or reference pixels that are read closely in time. Schlawin et al. (2020) removed the 1/f noise as a step in the pipeline after the superbias correction. 71 Hilbert et al. (2016) presented a method to subtract 1/f noise from NIRCam integrations before averaging the data to produce superbias maps. This method produced superbias images with significantly lower noise levels than images produced using the more traditional approach. Wilmott & the NIRISS GTO team (2022) provided a more recent code to remove 1/f noise that runs on the calibrated files. 72 Bagley et al. (2022) presented a code to remove both the detector-level offsets in the SW modules and the 1/f noise patterns. This code was produced for the CEERS project and is part of their SDR1 release. 73
We used both the Willott code and the ProFound code (Robotham et al. 2017, 2018) to remove the 1/f noise patterns. Together with the low-level pedestal removal between the SW detectors below, the ProFound-package resulted in images that are mostly visually flat without major row-based artifacts. We visually verified that the 1/f noise-removal parameter settings did not introduce new artifacts in the final images. Further details are given in Appendix A, which compares the results from both 1/f-noise removal methods and verifies that these do not noticeably affect object photometry at S/N levels ≳5σ.
2. SW Detector-Level Offsets: the eight detectors in the SW modules A and B have detector-level offsets that are a combination of additive and multiplicative corrections, although most of the effect seems to be additive. Except in very crowded fields, these detector-level offsets are relatively easy to remove early in our data reduction workflow with the ProFound-based code (Robotham et al. 2018), as implemented in our previous HST WFC3/IR work (e.g., Windhorst et al.2022). In short, with ProFound we created a new fits extension SKY that removed bad pixels and real objects detected to AB ≲ 28.5 mag (Section 4) and that interpolated the local sky-SB plus its local rms noise underneath each object. With a number of images in the NIRCam broadband filters now available, we created a low-frequency supersky image "SKY_SUPER" as a clipped mean over these SKY images. The SKY images were then subtracted from each science SCI image using:

where M and P describe the linear model and pedestal, respectively, of the SKY image pixels made for each detector and filter combination from these SKY_SUPER frames. In this process, we also determined the lowest object-free sky-SB in each detector following Section 4.2 of Windhorst et al. (2022), which is used for sky-SB estimates in our 13 PEARLS filters in Section 5. By design, our medium-deep PEARLS images come from relatively short integrations (Tables 1–2), and we adjusted our signal-to-noise-ratio criteria for object detection (Section 4) to achieve uniform detection above any residual 1/f-noise patterns. Further details of the 1/f and pedestal removal procedures are given in Appendix A.
3. NIRCam SW Detector Wisps: the so-called "wisps" are caused by straylight hitting a secondary mirror support bar and then being reflected into the main light path. Only four NIRCam detectors are affected (SW A3, A4, B3, and B4) and mainly in the F090W, F115W, F150W, F182M, 200W, and F210M filters. Wisp positions are fixed on the telescope and each detector, and therefore a sky-flat made in a given filter from available images is able to subtract much of the wisp pattern locally. We used our NIRCam images to improve available wisp templates to be subtracted from the images that show visible wisps. We then subtracted the wisp template from each image that best matches the wisp amplitude. This amplitude needs to be high enough that no significant positive wisp signal is left but not so high that a negative hole is created in the local sky-SB. Some wisp residuals are left in some of the images, and we masked these areas in the faint-object-detection phase (Section 4.1) and in the sky-SB analysis (Section 5). Steady collection of NIRCam images over time is expected to improve the wisp templates to allow more accurate subtraction in future image reductions.
4. NIRCam Snowballs: NIRCam detectors can show large artifacts that resemble "snowballs" when an energetic cosmic-ray impact occurs. 74 The vast majority of CR hits impact only a few detector pixels, but snowballs can affect several hundred pixels. They occur approximately at a rate of 50 snowballs per 1000 s of exposure time in each NIRCam detector. Our four-point dithers enable the pipeline to remove many of the snowball artifacts, but this process is not perfect. E.g., Figure 2 shows a few dim green rings left over from snowballs that were not fully removed in the drizzling process of the JWIDF F200W images. Because the drizzle weight-maps give these pixels a lower weight, we can still derive catalogs from this image. Nevertheless, we vet these catalogs carefully and mask out areas that are visibly affected by residual snowballs when doing faint object counts as in Section 4. That is, any large remaining defects that generate a local excess in the object catalogs are masked before running our final catalogs.
5. NIRCam PSFs: JWST NIRCam Point Spread Functions are detailed on the STSCI website. 75 We generated JWST PSFs with the WebbPSF tool. 76 Brighter star images (Section 4.1) have PSF FWHM values consistent with a diffraction limited telescope at 1.1 μm wavelength (Rigby et al. 2022), i.e., much better than the JWST Observatory requirement of a diffraction limit that was designed and kept during development at 2.0 μm (Section 4.4).
6. NIRCam Flat Fields: the accuracy of the NIRCam flat-fields is better than 7% rms (B. Sunnquist 2022, private communication) and has improved to ∼2% with the release of the flat fields captured in jwst_0952.pmap_filters and most recently jwst_0995.pmap_filters. We processed our images with this latest context file to estimate the sky-SB values in each exposure and assess their quality in Section 5. Table 3 summarizes the parameters that characterize the 0.9–4.5 μm galaxy counts and integrated galaxy light, which are needed in Tables 4–6 (see Section 5). Tables 4–5 gives the predicted and observed sky-SB for the three PEARLS targets observed in 4–8 broadband NIRCam filters, and Table 6 gives the values for TNJ1338 and its five medium-band filters.
Table 3. Parameters of 0.9–4.5 μm Galaxy Counts and IGL Including JWST PEARLS Data
| λc | AB25% | AB50% | AB75% | IGL_FWHM | AB_peak | IGL_peak | Tot_IGL_int | IGL_tot | AB22slope | Err | Filter |
|---|---|---|---|---|---|---|---|---|---|---|---|
| (μm) | AB-mag | AB-mag | AB-mag | AB-mag | AB-mag | (W Hz−1 m−2 deg−2 mag−1) | (W Hz−1 m−2 deg−2) | (nW m−1 sr−1) | (dex mag−1) | (mag) | VISTA |
| 0.883 | 18.01 | 20.23 | 22.46 | 4.45 | 20.27 | 5.847e-28 | 4.688e-27 | 10.45 | 0.206 | 0.06 | z |
| ±0.03 | ±0.02 | ±0.01 | ±0.02 | ±0.01 | ±0.1% | ±0.4% | ±0.04 | ±0.001 | |||
| 1.020 | 17.89 | 20.08 | 22.37 | 4.48 | 19.99 | 7.404e-28 | 5.870e-27 | 11.33 | 0.231 | 0.07 | y |
| ±0.03 | ±0.02 | ±0.02 | ±0.02 | ±0.01 | ±0.1% | ±0.5% | ±0.06 | ±0.002 | |||
| 1.250 | 17.75 | 19.92 | 22.21 | 4.46 | 19.78 | 8.895e-28 | 7.117e-27 | 11.21 | 0.225 | 0.07 | j |
| ±0.03 | ±0.02 | ±0.01 | ±0.02 | ±0.01 | ±0.1% | ±0.3% | ±0.04 | ±0.002 | |||
| 1.650 | 17.59 | 19.63 | 21.85 | 4.26 | 19.40 | 1.233e-27 | 9.206e-27 | 10.98 | 0.234 | 0.06 | h |
| ±0.02 | ±0.02 | ±0.01 | ±0.02 | ±0.01 | ±0.1% | ±0.4% | ±0.04 | ±0.002 | |||
| 2.150 | 17.70 | 19.50 | 21.50 | 3.80 | 19.22 | 1.590e-27 | 1.063e-26 | 9.735 | 0.226 | 0.05 | k |
| ±0.02 | ±0.01 | ±0.01 | ±0.01 | ±0.01 | ±0.1% | ±0.3% | ±0.10 | ±0.002 | |||
| 3.540 | 18.95 | 20.40 | 22.15 | 3.20 | 19.90 | 1.464e-27 | 8.242e-27 | 4.583 | 0.205 | 0.04 | IRAC1 |
| ±0.01 | ±0.01 | ±0.01 | ±0.01 | ±0.01 | ±0.1% | ±0.2% | ±0.09 | ±0.002 | |||
| 4.490 | 19.31 | 20.79 | 22.43 | 3.12 | 20.18 | 1.200e-27 | 6.964e-27 | 3.053 | 0.189 | 0.04 | IRAC2 |
| ±0.01 | ±0.01 | ±0.01 | ±0.01 | ±0.01 | ±0.1% | ±0.2% | ±0.05 | ±0.002 |
Note. See Section 4.6 for definition of these parameters. The formal fitting errors are listed below each parameter value. Because of the vast statistics and dynamic range in the combined galaxy counts from AB ≃ 10–29 mag, the fitting errors are much smaller than the NIRCam ZP- and AB-flux scale transformation uncertainties of Appendix B.2, which are listed in column 11. These combined errors are therefore used for the IGL parameters of Figure 11.
Download table as: ASCIITypeset image
Table 4. PEARLS Sky-SB: ETC Predictions, JWST Observations, DGL, eEBL, Kelsall 1998 Model, and Diffuse Light Limits
| Field/sky-SB | Obs. Date | F090W | F115W | F150W | F200W | F277W | F356W | F410M | F444W |
|---|---|---|---|---|---|---|---|---|---|
| λc (μm): | 0.8985 | 1.1434 | 1.4873 | 1.9680 | 2.7279 | 3.5287 | 4.0723 | 4.571 | |
| MJy/(nW m−2): | 3337 | 2622 | 2016 | 1523 | 1099 | 849.6 | 736.2 | 655.9 | |
| VV191-Backlit | 2022-07-02 | ||||||||
| Rigby22-straylight | 0.052496 | 0.080266 | 0.073986 | 0.061728 | 0.058747 | 0.038679 | 0.037862 | 0.035899 | |
| ETC-straylight | 0.045678 | 0.048888 | 0.043277 | 0.032939 | 0.026557 | 0.019997 | 0.025215 | 0.037771 | |
| ETC-zodi | 0.280842 | 0.232496 | 0.199449 | 0.156536 | 0.101723 | 0.094726 | 0.152429 | 0.311742 | |
| ETC thermal | 0.000000 | 0.000000 | 0.000000 | 0.000000 | 0.000003 | 0.000234 | 0.001226 | 0.004315 | |
| L2-Zodi-Pred | 0.194767 | 0.164668 | 0.137195 | 0.103823 | 0.068512 | 0.067173 | 0.131417 | 0.297195 | |
| (0.008508) | (0.006757) | (0.005367) | (0.004135) | (0.003078) | (0.002592) | (0.004548) | (0.006025) | ||
| 1.0*Straylight(R22) | 0.052496 | 0.080266 | 0.073985 | 0.061723 | 0.058747 | 0.038679 | 0.037862 | 0.041315 | |
| (0.010499) | (0.016053) | (0.014797) | (0.012346) | (0.011752) | (0.007736) | (0.007572) | (0.007180) | ||
| DGL-Predict | 0.000361 | 0.000661 | 0.000809 | 0.000809 | 0.001068 | 0.001509 | 0.001826 | 0.002140 | |
| (0.000181) | (0.000331) | (0.000405) | (0.000405) | (0.000535) | (0.000755) | (0.000913) | (0.001004) | ||
| PEARLS-IGL | 0.003198 | 0.004292 | 0.005560 | 0.006817 | 0.006979 | 0.005455 | 0.004803 | 0.004636 | |
| PEARLS-IGL(>28.5) | 0.000078 | 0.000107 | 0.000139 | 0.000170 | 0.000175 | 0.000136 | 0.000120 | 0.000114 | |
| Total-Predict-skySB | 0.24770 | 0.24570 | 0.21213 | 0.16653 | 0.12851 | 0.10773 | 0.17245 | 0.34508 | |
| (0.01351) | (0.01742) | (0.01575) | (0.01302) | (0.01215) | (0.00819) | (0.00888) | (0.01106) | ||
| PEARLS Observ-skySB | 0.2007 | ⋯ | 0.2273 | ⋯ | ⋯ | 0.1124 | ⋯ | 0.3193 | |
| (0.0252) | ⋯ | (0.0174) | ⋯ | ⋯ | (0.0059) | ⋯ | (0.0132) | ||
| Obs-Pred (MJy sr−1) | <0 | ⋯ | 0.0152 | ⋯ | ⋯ | 0.0047 | ⋯ | <0 | |
| Obs-Pred (nW m−2 sr−1) | <0 | ⋯ | 31 | ⋯ | ⋯ | 4 | ⋯ | <0 | |
| DL-upper-limit (nW) | <95 | ⋯ | <47 | ⋯ | ⋯ | <9 | ⋯ | <11 | |
Note. The top two lines give the effective wavelength of each NIRCam filter, and the factors needed to convert units of MJy sr−1 to nW m−2 sr−1. Obs. Date is the actual observing date of the PEARLS target. For each target, line 1 gives the Rigby et al. (2022) straylight in MJy sr−1 for each filter. Lines 2–4 give quantities predicted by the JWST-ETC: straylight; Zodiacal Light; and thermal radiation from a telescope model. Line 5+6 give the Zodiacal foreground predicted for L2 at the time of the observation from the Spitzer IPAC model and its uncertainty. All (model) uncertainties are between parentheses, with details on the error budgets in Appendices B–C. Line 7+8 give the adopted straylight level and its multiplier, f, following Section 5.2. Line 9+10 give the Diffuse Galactic Light level predicted by the IPAC IRSA model. Line 11+12 give the IGL levels from Section 4.6 and Table 3, as well as the eEBL, i.e., the IGL fraction that comes from beyond our typical NIRCam detection limits (AB ≳ 28.5 mag). Line 13+14 give the total predicted NIRcam sky-SB in each, following Equation (5). Line 15+16 give the observed NIRCam sky-SB in each JWST image measured between the detected objects (Section 5.2 and Windhorst et al. 2022). Line 17+18 give the difference between the Observed–Predicted sky-SB in MJy sr−1 and nW m−2 sr−1, respectively. Line 18 gives our 1σ upper limit to diffuse light in nW m−2 sr−1 for each observed PEARLS filter, accounting for the full error budgets in both the Observed and Predicted sky-SB values in Appendices B–C.
Download table as: ASCIITypeset image
Table 5. PEARLS Sky-SB: ETC Predictions, JWST Observations, DGL, eEBL, Kelsall 1998 Model, and Diffuse Light Limits
| Field/sky-SB | Obs. Date | F090W | F115W | F150W | F200W | F277W | F356W | F410M | F444W |
|---|---|---|---|---|---|---|---|---|---|
| λc (μm): | 0.8985 | 1.1434 | 1.4873 | 1.9680 | 2.7279 | 3.5287 | 4.0723 | 4.571 | |
| MJy/(nW m−2): | 3337 | 2622 | 2016 | 1523 | 1099 | 849.6 | 736.2 | 655.9 | |
| JWIDF-epoch1 | 2022-07-08 | ||||||||
| Rigby22-straylight | 0.052496 | 0.080266 | 0.073986 | 0.061728 | 0.058747 | 0.038679 | 0.037862 | 0.035899 | |
| ETC-straylight | 0.045758 | 0.059683 | 0.055036 | 0.043173 | 0.038475 | 0.026917 | 0.030043 | 0.035379 | |
| ETC-zodi | 0.175812 | 0.146354 | 0.127120 | 0.102019 | 0.069139 | 0.069044 | 0.114380 | 0.231812 | |
| ETC thermal | 0.000000 | 0.000000 | 0.000000 | 0.000000 | 0.000003 | 0.000234 | 0.001226 | 0.004315 | |
| L2-Zodi-Pred | 0.090777 | 0.077508 | 0.065341 | 0.050712 | 0.033910 | 0.041297 | 0.095256 | 0.220162 | |
| (0.008508) | (0.006757) | (0.005367) | (0.004125) | (0.003085) | (0.002592) | (0.004548) | (0.006025) | ||
| 1.0*Straylight(R22) | 0.052496 | 0.080266 | 0.073986 | 0.061727 | 0.058747 | 0.038679 | 0.037862 | 0.041315 | |
| (0.010499) | (0.016053) | (0.014797) | (0.012345) | (0.011754) | (0.007736) | (0.007572) | (0.007180) | ||
| DGL-Predict | 0.001096 | 0.002004 | 0.002454 | 0.002454 | 0.003246 | 0.004577 | 0.005537 | 0.006490 | |
| (0.000548) | (0.001002) | (0.001227) | (0.001227) | (0.001623) | (0.002289) | (0.002769) | (0.003045) | ||
| PEARLS-IGL | 0.003198 | 0.004292 | 0.005560 | 0.006817 | 0.006979 | 0.005455 | 0.004803 | 0.004636 | |
| PEARLS-IGL(>28.5) | 0.000078 | 0.000107 | 0.000139 | 0.000170 | 0.000175 | 0.000136 | 0.000120 | 0.000114 | |
| Total-Predict-skySB | 0.14445 | 0.15989 | 0.14192 | 0.11506 | 0.09608 | 0.08492 | 0.14000 | 0.27240 | |
| (0.01352) | (0.01745) | (0.01579) | (0.01307) | (0.01225) | (0.00847) | (0.00926) | (0.01147) | ||
| PEARLS Observ-skySB | ⋯ | ⋯ | 0.1672 | 0.1350 | ⋯ | 0.0857 | ⋯ | 0.2433 | |
| ⋯ | ⋯ | (0.0107) | (0.0087) | ⋯ | (0.0039) | ⋯ | (0.0101) | ||
| Obs-Pred (MJy sr−1) | ⋯ | ⋯ | 0.0253 | 0.0199 | ⋯ | 0.0008 | ⋯ | <0 | |
| Obs-Pred (nW m−2 sr−1) | ⋯ | ⋯ | 51 | 30 | ⋯ | 1 | ⋯ | <0 | |
| DL-upper-limit (nW) | ⋯ | ⋯ | (38) | (24) | ⋯ | <8 | ⋯ | <10 | |
| El-Gordo: | 2022-07-29 | ||||||||
| ETC-straylight | 0.039684 | 0.043976 | 0.039169 | 0.029558 | 0.024191 | 0.017063 | 0.019863 | 0.026836 | |
| ETC-zodi | 0.233085 | 0.193308 | 0.164389 | 0.126978 | 0.081585 | 0.071304 | 0.106510 | 0.211112 | |
| ETC thermal | 0.000000 | 0.000000 | 0.000000 | 0.000000 | 0.000003 | 0.000234 | 0.001226 | 0.004315 | |
| L2-Zodi-Pred | 0.159645 | 0.133880 | 0.110478 | 0.082512 | 0.053512 | 0.047257 | 0.084041 | 0.188139 | |
| (0.008508) | (0.006757) | (0.005367) | (0.004126) | (0.003080) | (0.002592) | (0.004548) | (0.006025) | ||
| 0.8*Straylight(R22) | 0.041997 | 0.064213 | 0.059188 | 0.049387 | 0.047033 | 0.030943 | 0.030290 | 0.033052 | |
| (0.010499) | (0.016053) | (0.014797) | (0.012346) | (0.011755) | (0.007736) | (0.007572) | (0.007180) | ||
| DGL-Predict | 0.000248 | 0.000454 | 0.000556 | 0.000556 | 0.000734 | 0.001037 | 0.001255 | 0.0014710 | |
| (0.000124) | (0.000227) | (0.000278) | (0.000278) | (0.000369) | (0.000519) | (0.000628) | (0.000691) | ||
| PEARLS-IGL | 0.003198 | 0.004292 | 0.005560 | 0.006817 | 0.006979 | 0.005455 | 0.004803 | 0.004636 | |
| PEARLS-IGL(>28.5) | 0.000078 | 0.000107 | 0.000139 | 0.000170 | 0.000175 | 0.000136 | 0.000120 | 0.000114 | |
| Total-Predict-skySB | 0.20197 | 0.19865 | 0.17036 | 0.13263 | 0.10146 | 0.07961 | 0.11693 | 0.22709 | |
| (0.01351) | (0.01742) | (0.01574) | (0.01302) | (0.01216) | (0.00818) | (0.00886) | (0.01103) | ||
| PEARLS Observ-skySB | 0.1671 | 0.1822 | 0.1784 | 0.1387 | 0.0840 | 0.0798 | 0.1243 | 0.2163 | |
| (0.0125) | (0.0110) | (0.0108) | (0.0116) | (0.0038) | (0.0046) | (0.0066) | (0.0090) | ||
| Obs-Pred (MJy sr−1) | <0 | <0 | 0.0080 | 0.0061 | <0 | 0.0002 | 0.0074 | <0 | |
| Obs-Pred (nW m−2 sr−1) | <0 | <0 | 16 | 9 | <0 | 0 | 5 | <0 | |
| DL-upper-limit (nW) | <61 | <54 | <38 | <27 | <14 | <8 | <8 | <9 | |
Note. Same as in Table 4.
Download table as: ASCIITypeset image
7. NIRCam Zero-points: Measured zero-points (ZPs) for all JWST+NIRCam+Filters are on the STScI website. 77 The JWST Mission Requirement is that the absolute ZPs of the imaging filters are known to better than 5%, 78 and they are stated to be good to ∼4% or better for Cycle 1 (Rigby et al. 2022). The "Throughput" column in their Tables 4–5 lists the in-flight zero-points in units of DN/s/nJy.
Results based on the initial v0.5 calibrations are recorded in our first submission of this paper on https://arxiv.org/abs/2209.04119. Boyer et al. (2022) 79 and their cited URLs analyzed new standard star observations and updated the NIRCam ZPs. Our v1 results below use this latest calibration, which more accurately corrects for ZP variations between each of the 10 NIRCam detectors. Typical ZP changes for individual detectors were ≲10%–20%. The new NIRCam F356W and F444W zero-points produce photometry in the JWIDF field consistent with the deepest Spitzer images available to within 2.6%–2.9% (Yan et al. 2018). The v1 calibration also tightened the dispersion between the bright end of the NIRCam galaxy counts and the faint end of the ground-based, HST, and Spitzer galaxy counts. The uncertainty in our estimates of the Integrated Galaxy Light in Section 4 went down, the rms variation between the sky-SB measurements decreased, and our limits on diffuse light in Section 5 improved. Further details of the calibration improvements are given in Appendix B.1.
For context, all HST ZPs were defined in units of AB-mag for a count rate of 1.000 e− pixel−1 s−1. This definition permitted monitoring of the ZPs' wavelength and time dependence over many decades (e.g., Calamida et al. 2022; Windhorst et al. 2011, 2022). (For a summary, see Section 4 and references therein of Windhorst et al. 2022.) However, all JWST ZPs instead have been defined in units of MJy sr−1. Conversion between the two sets of units can be made using the footnotes of Section 1 but also requires knowledge of the drizzled pixel scale in the case of JWST. For completeness, we therefore list both the drizzled pixel scale and the resulting equivalent ZP in AB-mag for our PEARLS NIRCam images in the footnotes of Table 1 and in Appendix B.1.
Note that given this different JWST ZP definition, the equivalent JWST ZPs in AB-mag are no longer wavelength dependent—unlike the case of HST—but only depend on the image pixel scale, which therefore should always be stated. To leave no further ambiguity, for our basic drizzled pixel scale of 00300 pixel−1, the JWST ZP for 1.000 MJy sr−1 converted to AB-mag would thus be the following same value for every wavelength:
The constant 28.0865 in Equation (2) will be valid at all wavelengths for all our images at 00300 pixel−1
if the flux calibration is correct. With the v1 calibration, this appears to be the case to within 3%–4% (see Appendix B.1.)
8. NIRCam Straylight Levels: JWST has an open-architecture Optical Telescope Element (OTE), and it will have more straylight (SL) than a closed-tube design such as HST or Spitzer. The JWST Project designed the JWST sunshield and baffles to minimize SL with expected levels ≲20%–40% (worst case) of the Zodiacal SB in a given direction. Bright near-IR sources like the Zodiacal cloud, Galactic Center and Galactic plane—the brightest NIR sources in the sky other than the Sun, Earth, and Moon—can add SL that scatters off dust accumulated on the primary mirror into the telescope FOV. Estimates of the SL levels have been made by, e.g., Lightsey (2016) and are incorporated in extensions of the JWST ETC predictions. Tables 4–6 show the predicted SL levels for our PEARLS targets. The predicted SL levels are modest at 0.9–3.5 μm, but they increase at wavelengths longer than 4.5 μm due to the increased thermal foreground from the telescope and Zodiacal belt. Further details on the adopted SL levels are given in Section 5 and Appendix C.
Table 6. PEARLS sky-SB: ETC Predictions, JWST Observations, DGL, eEBL, Kelsall 1998 Model, and Diffuse Light Limits
| Field/sky-SB | Obs. Date | F090W | F115W | F150W | F182M | F210M | F300M | F335M | F360M |
|---|---|---|---|---|---|---|---|---|---|
| λc (μm): | 0.8985 | 1.1434 | 1.4873 | 1.8389 | 2.0908 | 2.9818 | 3.3538 | 3.6148 | |
| MJy/(nW m−2): | 3337 | 2622 | 2016 | 1630 | 1434 | 1005 | 893.9 | 829.3 | |
| TNJ1338-1942 | 2022-07-01 | ||||||||
| Rigby22-straylight | 0.052496 | 0.080266 | 0.073986 | 0.063820 | 0.061010 | 0.040995 | 0.019612 | 0.038679 | |
| ETC-straylight | 0.067593 | 0.075166 | 0.067042 | 0.057724 | 0.052513 | 0.034902 | 0.031816 | 0.033530 | |
| ETC-zodi | 0.445802 | 0.369774 | 0.317401 | 0.270570 | 0.231493 | 0.142155 | 0.118576 | 0.144350 | |
| ETC thermal | 0.000000 | 0.000000 | 0.000000 | 0.000000 | 0.000000 | 0.000015 | 0.000087 | 0.000321 | |
| L2-Zodi-Pred | 0.438665 | 0.369418 | 0.303688 | 0.247075 | 0.213238 | 0.120340 | 0.107623 | 0.105611 | |
| (0.008508) | (0.006757) | (0.005367) | (0.004445) | (0.003920) | (0.002833) | (0.002551) | (0.002847) | ||
| 0.5*Straylight(R22) | 0.026248 | 0.040133 | 0.036993 | 0.031910 | 0.030505 | 0.020496 | 0.020354 | 0.019340 | |
| (0.010499) | (0.016053) | (0.014797) | (0.012764) | (0.012202) | (0.008192) | (0.007922) | (0.007736) | ||
| DGL-Predict | 0.001249 | 0.002285 | 0.002798 | 0.002798 | 0.002798 | 0.004154 | 0.007570 | 0.005385 | |
| (0.000624) | (0.001142) | (0.001399) | (0.001399) | (0.001399) | (0.002086) | (0.003785) | (0.002693) | ||
| PEARLS-IGL | 0.003198 | 0.004293 | 0.005560 | 0.006554 | 0.007014 | 0.006589 | 0.005822 | 0.005326 | |
| PEARLS-IGL(>28.5) | 0.000078 | 0.000107 | 0.000139 | 0.000164 | 0.000175 | 0.000165 | 0.000146 | 0.000133 | |
| Total-Predict-skySB | 0.46624 | 0.41194 | 0.34362 | 0.28195 | 0.24672 | 0.14517 | 0.13578 | 0.13079 | |
| (0.01353) | (0.01746) | (0.01580) | (0.01359) | (0.01289) | (0.00892) | (0.00936) | (0.00867) | ||
| PEARLS Observ-skySB | ⋯ | ⋯ | 0.3106 | 0.2750 | 0.2301 | 0.1287 | 0.1361 | 0.1380 | |
| ⋯ | ⋯ | (0.0186) | (0.0289) | (0.0263) | (0.0074) | (0.0064) | (0.0086) | ||
| Obs-Pred (MJy sr−1) | ⋯ | ⋯ | <0 | <0 | <0 | <0 | 0.0003 | 0.0072 | |
| Obs-Pred (nW m−2 sr−1) | <0 | <0 | <0 | <0 | <0 | <0 | 0 | 6 | |
| DL-upper-limit (nW) | ⋯ | ⋯ | <49 | <52 | <42 | <12 | <10 | <10 | |
Note. Same as in Table 4.
Download table as: ASCIITypeset image
Once we have verified that the astrometry and zero-points of the images are robust, our v1 mosaics and catalogs will be made available via our PEARLS websites. 80
4. NIRCam Catalogs
4.1. PEARLS NIRCam Catalog Construction
We used both the SourceExtractor (Bertin & Arnouts1996) and ProFound (Robotham et al. 2018) packages to generate object catalogs from our processed NIRCam images. Both packages were designed to deblend close objects and find the object total fluxes. Details of these procedures are given by Windhorst et al. (2011, 2022), and we applied similar procedures to the PEARLS NIRCam images. The current paper focuses on single-filter PEARLS object catalogs, and so we use the single-filter mode of object detection with SourceExtractor. That is, we defer the SourceExtractor steps necessary to produce accurate object colors, such as dual image-mode extraction, the production of band-merged catalogs, and the application of PSF-matching and aperture corrections to future papers, which will study the colors of faint stars and galaxies (R. Ryan et al. 2022, in preparation) as well as high-redshift dropout candidates (e.g., Yan et al. 2022).
The SourceExtractor input parameters for the NIRCam images used a minimum detection threshold above sky of 1.5σ and nine connected pixels above this threshold for inclusion in the catalog. We found that using fewer connected pixels resulted in too many small spurious sources, particularly in the LW images, where the original pixel size is larger. While the more stringent nine-pixel requirement may result in missing a few real sources at the faint end, we found this to be a good compromise between reliability and completeness at all wavelengths. To detect sources, we used a 5 × 5 pixel convolution filter with Gaussian FWHM of 3.0 pixels (0090). This value is close to the median size of the faintest galaxies in Figures 6–8 (i.e., with object FWHM ∼ 01 or half-light radii re
≃ 005), which enables us to better detect very faint, low-SB, or clumpy galaxies. The SourceExtractor parameter DEBLEND_MINCONT was set to 0.06 to assure that real objects were not over-deblended. These parameters were chosen as a balance between extracting objects deep enough to achieve sample completeness to approximately the 5σ detection level (Section 4.2) but not so deep that a visible number of bogus objects were detected around remaining low-level image artifacts (Section 3.3).

Figure 6. Object detection, classification, and counts in the El Gordo noncluster module in the F090W, F115W, F150W, and F200W filters. (a) (Left): SourceExtractor AB-magnitude error bars vs. MAG_AUTO AB-mag resulting from the adopted SourceExtractor-parameters (Section 3.1). Horizontal dashed lines show the adopted 5σ point-source detection limits (Table 1). (b) (Middle): star–galaxy classification diagram based on SourceExtractor MAG_AUTO AB-magnitudes vs. image FWHM. Left solid vertical lines indicate the NIRCam diffraction limit for each image with its current sampling. Blue points represent galaxies. The box to the right of the vertical line identifies objects classified as stars (red points). Objects with FWHM < FWHM(PSF) have been flagged and removed from this plot as spurious detections or border imperfections. The green dashed lines indicate for each image the effective point-source (horizontal) and SB (slanted) detection limits. (c) (Right): resulting star counts (red) and galaxy counts (blue). The vertical dashed line is the limit to which stellar objects are defined.
Download figure:
Standard image High-resolution image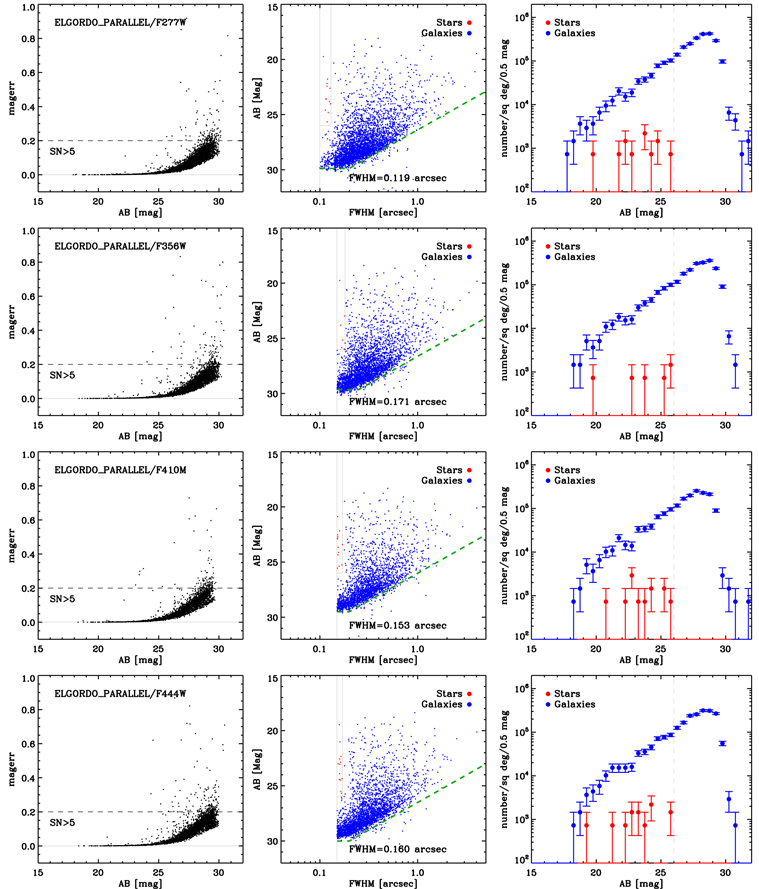
Figure 7. Same as Figure 6 for the object detection, classification, and counts in the El Gordo noncluster module in the F277W, F356W, F410M, and F444W filters. (Please magnify these PDF plots to see all data points.)
Download figure:
Standard image High-resolution image
Figure 8. Same as Figure 6 for the object detection, classification, and counts for all detectors covering the JWIDF in the F150W, F200W, F356W, and F444W filters. (Please magnify these figures to see all data points.)
Download figure:
Standard image High-resolution imageFor all images and filters, the corresponding weight maps were used to account for image borders and properly characterize the photometric uncertainties and the effective areas for each drizzled mosaic. We compared our catalogs to the actual images and weight maps to look for any visible excess objects near residual image structures and snowballs and where needed applied additional masking to the images and their weight maps. Most masked regions are due to edge effects, low-exposure regions, or strips due to the dither pattern adapted for our shallow PEARLS exposures. Some bright stellar diffraction spikes (e.g., Figure 3) and residual wisp patterns also required masking. All of these masked areas were excluded when calculating galaxy number counts (Section 4.5).
The first line of Table 1 lists the J2000 tangent point to which the images in all filters of each target were drizzled, the observing date, the APT visit number, the area covered, the net exposure time per filter and total net hours, and the spacecraft efficiency of that visit. The second line for each filter lists the PSF FWHM, and the third line lists the 5σ point-source sensitivity in AB-mag predicted by the prelaunch ETC for the net integration time on the first line of each target. The fourth line in each filter indicates the achieved ∼5σ detection limits. The values were derived from Figures 6–8 as the median AB magnitude where SourceExtractor reports flux error bars of 0.20 mag. The fifth line indicates the AB level in Figures 6–8 where the galaxy counts are ∼80% complete compared to a power-law extrapolation, as derived from the figures in Section 4.5.
4.2. PEARLS Star–Galaxy Classification Procedure
Separating stars from galaxies is important, especially for the PEARLS NEP fields, which are located at Galactic latitudes +316 (JWIDF) and +336 (TDF). Fields at these latitudes are expected to have more faint brown dwarfs than fields at higher Galactic latitudes (e.g., Ryan et al. 2011, 2017, 2022; Jansen & Windhorst 2018). The PEARLS star–galaxy classification procedure is based on the method described by Windhorst et al. (2011) for the ten-band WFC3 ERS images and by Windhorst et al. (2022) for the HST Archival Legacy project SKYSURF sample of ∼249,000 HST images. Figures 6–8 show the object detection, classification, and count diagnostics used for the JWIDF, as well as for the El Gordo noncluster module, respectively.
For each detected object, the left panels show the SourceExtractor magnitude error versus MAG_AUTO AB-mag. The horizontal dashed line indicates the adopted detection limit where the MAG_AUTO error is ≥0.20 mag, which approximately corresponds to a ∼5σ detection for point sources. Table 1 lists the average AB-mag values where the MAG_AUTO error reaches ≥0.20 mag, as derived from the left panels of Figures 6–8.
The middle panels shows the star–galaxy classification diagram using SourceExtractor MAG_AUTO AB-magnitudes versus image FWHM. The NIRCam diffraction limit is indicated in by the full-drawn left-most vertical line, and the FWHM of the PSF is listed in the legend of each middle panel and in Table 1. Objects with FWHM < FWHM(PSF) have been flagged and removed from this plot as spurious detections or border imperfections. In short, objects detected by SourceExtractor with sizes straddling the NIRCam diffraction limit to a certain magnitude limit are classified as stars (red dots), following Windhorst et al. (2011). Stars are generally located in a thin nearly vertical column bordered by the right-most vertical line. The remaining objects are classified as galaxies (blue dots). The green dotted–dashed lines indicate the 5σ sensitivity limits of each image, with the horizontal part showing the ∼5σ point-source limit and the slanted part showing the SB limit. For further details, see Windhorst et al.(2022).
The right panels of Figures 6–8 show the resulting star counts (red filled circles) and galaxy counts (blue filled circles). At most wavelengths ≳0.9 μm and at intermediate to high Galactic latitudes, the star counts generally have a very flat slope (γ ≃ 0.04 dex mag−1), while the galaxy counts have relatively steep slopes γ ≃ 0.21–0.25 dex mag−1, continuing the trend seen at 0.2–1.6 μm wavelengths by Windhorst et al. (2011). As a consequence, galaxies generally dominate the object counts for AB ≳ 18 mag and far outnumber Galactic stars at fainter magnitudes. Hence, reliable identification of faint objects as stars becomes difficult for AB ≳ 26–27 mag, and we have treated all objects fainter than this as galaxies. (The specific limiting values for each filter are shown in the right panels of Figures 6–8.)
Future work may be able to expand the identification of somewhat fainter stars through color–color diagrams and comparison with theoretical stellar loci. In a prior HST study (Windhorst et al. 2011), comparison of the ten-band WFC3 ERS star counts to Galactic-structure model predictions verified the star–galaxy classification procedure a posteriori. A similar check for the TDF data is described by R. Ryan et al. (2022, in preparation). Windhorst et al. (2011) also checked their star counts against spectroscopic ones from the HST ACS R ∼ 100 grism survey "PEARS" (Probing Evolution And Reionization Spectroscopically; Pirzkal et al. 2009). Such a posteriori verification of our star–galaxy classification procedure will be possible for the PEARLS TDF data when we receive the NIRISS grism spectra in all four NEP TDF epochs later in Cycle 1.
Star–galaxy classification in JWST NIRcam images is—ironically—hardest at the bright magnitude levels of AB ≃ 18–20 mag, as can be seen from Figures 6–8. These bright objects are generally unsaturated in the NIRCam images, but their significant diffraction spikes make FWHM an unreliable indicator. The spikes also make it difficult to derive accurate magnitudes and colors for identifying Galactic stars, as was done for the WFC3/IR images of Windhorst et al. (2011). We therefore used the Gaia DR3 (e.g., Gaia Collaboration et al. 2022) catalog to identify stars with AB ≲ 19 mag through their nonzero proper motions and the SDSS DR7 spectroscopic catalog to identify stars with available spectra at AB ≲ 17.5 mag.
4.3. Reliability of the PEARLS Star–Galaxy Classification Procedure
As indicated above, the complex shape of the JWST PSF makes star–galaxy separation more difficult for objects with 18 ≲ AB ≲ 21 mag. Another complication is that an AGN can appear as a point source strong enough to hide the host galaxy and make the object appear stellar even in the JWST images. To verify whether the automated star–galaxy separation of Figures 6–8 was done correctly, we therefore proceeded as follows.
(a) Two independent visual observers inspected all objects (both those classified as stars and as galaxies) with 18 ≲ AB ≲ 21 mag to arrive at a consensus on which bright objects are stars and those that are compact galaxies with or without weak AGN. This was done in all 4–8 filters in the JWIDF and El Gordo noncluster fields. In the JWIDF, we found no objects classified among the 20 brightest stars (18 ≲ AB ≲ 24.4 mag) at the shorter wavelengths that were classified as galaxies at the long wavelengths. In El Gordo, we found eight possible galaxies among the 20 brightest objects classified as stellar. So in total the fraction of brighter stellar objects that are misclassified galaxies is about 20%.
(b) We required that stars needed to be classified as such in at least 2 out of 4–8 NIRCam filters using using the method in the middle panels of Figures 6–8. Windhorst et al. (2011) required a stellar object to be classified as such in at least 3 out 10 their HST ACS or WFC3 filters. This method found 69 objects classified as stellar in 2–4 JWIDF filters and 23 objects classified as stellar in two to eight filters in the El Gordo noncluster field. The surface density of stellar objects in Figures 6–8 is thus about 1000–2000 deg−2/0.5 mag in the El-Gordo noncluster module and JWIDF fields, respectively. The JWIDF is at lower Galactic latitude, and so has a higher surface density of stars. The results of (a) and (b) were largely consistent, and together reduced the number of bright stars that were misclassified as galaxies. This is reflected in the galaxy counts of Figures 9–10.
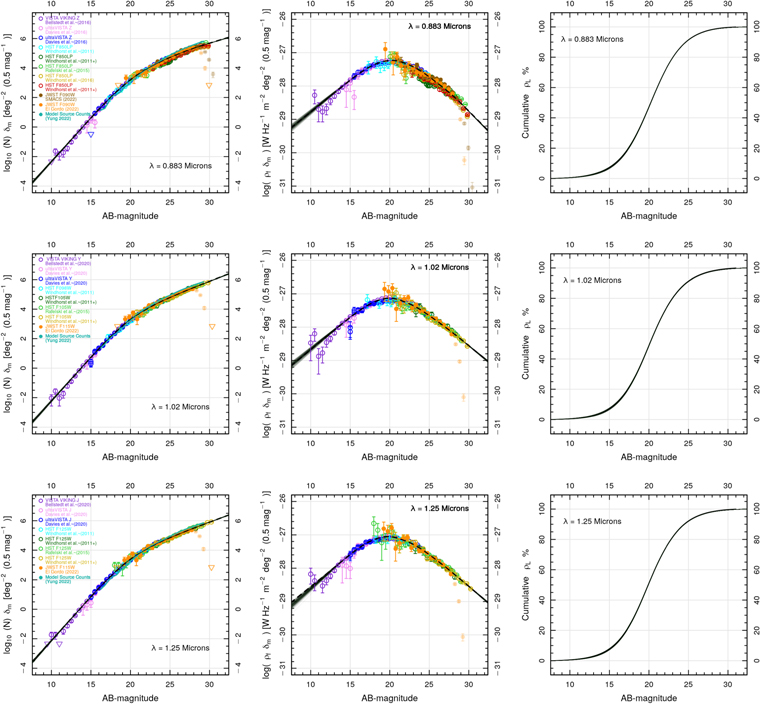
Figure 9. NIRCam galaxy counts in the JWIDF and the El Gordo noncluster module (orange and brown filled circles, respectively). Each row of three panels shows one wavelength as indicated in the panels. (a) (Left panels): differential galaxy counts in 0.5 mag bins. Open diamonds show a combination of previous ground-based, HST, and Spitzer/WISE counts (Driver et al. 2016a; Koushan et al. 2021) with different surveys shown in different colors as indicated in the legends. The green lines represent the hierarchical-model predictions for the 0.9–4.5 μm galaxy counts of Yung et al. (2022). When broadband filters in different instruments are similar but not identical, small corrections for effective wavelength differences may be needed (Robotham et al. 2020; Koushan et al. 2021, see Appendix B.2 here). (b) (Middle panels): energy counts after dividing the left panels by a 0.40 dex mag−1 slope. Units used are described in Section 4 and Koushan et al. (2021). Triangles without error bars indicate bins having only a single object. The brightest bins of the PEARLS counts at 18 ≲ AB ≲ 20 mag show cosmic variance (Sections 2 and 4.5), but do not weigh into the IGL fits, which at these flux levels are dominated by the faint end of the brighter surveys. PEARLS counts beyond the respective 80% completeness limits (as derived in Table 1 from a best-fit power-law extrapolation) are plotted as lightly shaded points, and are not included in the spline extrapolations to estimate the total IGL. (c) (Right panels): integral of the middle panels normalized to 100% of the IGL energy received.
Download figure:
Standard image High-resolution image
Figure 10. Same as Figure 9 for the ground-based+HST 1.6 and 2.2 μm and Spitzer 3.5 and 4.5 μm counts with JWST NIRCam counts in F150W, F200W, F356W and F444W as brown/olive filled circles in the JWIDF and El Gordo noncluster module.
Download figure:
Standard image High-resolution imageDespite the above procedures, our objects classified as "stellar" could still be contaminated by faint, compact galaxies or weak AGN. To estimate the contamination level by (weak) AGN, we must consider their expected surface density at near-IR wavelengths. In the optical, the QSO surface density is known to be ≲15 deg−2/0.5 mag to B ≲ 21 mag (Boyle et al. 2000) and ≲125 deg−2/0.5 mag to B ≲ 23 mag (Koo & Kron 1982). To predict surface densities at the JWST NIRCam wavelengths, we used the UV–far-IR data sets from the GAMA (Bellstedt et al. 2020a) and DEVILS (Davies et al. 2021) surveys with multiwavelength SED fits by Bellstedt et al. (2020b), Thorne et al. (2021), and Thorne et al. (2022). These codes used ProSpect (Robotham et al. 2020), which fits stellar and AGN SEDs with an AGN fraction fAGN at 1–2 μm wavelengths as a free parameter. We used the GAMA and DEVILS databases to estimate the surface densities of objects with 20 ≲ AB ≲ 25 mag and with SEDs in the VISTA ZYJH filters yielding fAGN ≳ 0.5–0.9. Similar to the behavior at the optical wavelengths above, the surface density of such weak AGN converges to ≲ 100–50 deg−2/0.5 mag for AB(1–2 μm) ≲ 25 mag and fAGN≳0.5–0.9, respectively. This amounts to ∼10% of our observed surface density of stellar objects of 1000–2000 deg−2/0.5 mag in the El-Gordo noncluster and JWIDF fields, comparable to our estimated ∼20% contamination rate of stellar samples by galaxies with weak AGN above. In conclusion, we expect that ∼10%–20% of our stellar samples may be contaminated by extragalactic objects. Future work that includes matched-aperture SED fits and PSF subtraction will be able to make a more accurate assessment of the fraction of compact galaxies or weak AGN remaining in our announced stellar samples.
4.4. The Wavelength-dependent Completeness of the PEARLS 0.9–4.5 μm Object Counts
Figures 6–8 show that the stellar locus moves steadily toward smaller FWHM values as wavelength decreases from 4.5 to 0.9 μm. This is a consequence of the JWST diffraction limit being much better than its requirement at 2.0 μm. That is, the stellar locus keeps moving to smaller object sizes from 2.0 to 1.5 μm and continues to do so down to 1.15 μm, although the stellar region does become somewhat wider in the F090W filter and in some fields in the F115W filter. Achieving a diffraction limit well below 2.0 μm wavelength is a major accomplishment for the JWST Project team, as this had to be planned between 2003 and 2005 without further driving up the Project cost. This was achieved by keeping the diffraction limit requirement at 2.0 μm but polishing the JWST mirrors well enough that the high-frequency wave front error would have a low enough rms to make a diffraction limit below 2.0 μm possible as long as the actuators below the mirrors could remove the main low- and mid-frequency errors well. The telescope in L2 is indeed able to do this (Rigby et al. 2022).
The consequences of this achievement by the JWST Project are far-reaching, as seen in the current paper: the median size of the faintest galaxies in the PEARLS images is about FWHM ≃ 01 as shown in all the SW panels of Figures 6–8. Hence, at JWST's diffraction limited SW resolution at ∼1.1–2.0 μm, essentially all faint galaxies in Figures 6–8 are resolved by NIRCam. In the LW 2.7–4.5 μm panels of Figures 6–8, a significant fraction of faint galaxies remain unresolved and therefore bunch up against the diffraction limits. Therefore, faint galaxies with flat SEDs are more easily detectable with the wider LW PSF of ∼017 FWHM compared to the SW PSF, which has 006–008 FWHM. This is especially visible in the filters F277W and longwards.
Table 1 quantifies the detection limits, using the 80% galaxy-count completeness limits as a fiducial value. These limits were determined from power-law fits to the counts and their extrapolations (Section 4.5). In all NIRCam SW filters, the 80% galaxy count completeness limits typically appear to be about −0.3 to −0.9 mag brighter than the 5σ point-source detection limits predicted by the prelaunch ETC. This is indicated by the  values on the sixth line for each target in Table 1. A small part of this difference is due to the fact that some SW filters can be ∼10% less sensitive than the prelaunch predictions (Rigby et al. 2022), but for the most part this "apparent loss" in SW point-source sensitivity occurs because the large majority of faint galaxies observed in NIRCam SW are no longer point sources. The simple reverse is true for the faintest galaxies in most NIRCam LW filters: our PEARLS LW galaxy counts appear to be between +0.0 and +0.7 mag more sensitive than the prelaunch ETC prediction for point sources. Part of this difference occurs because most LW filters are 20%–30% more sensitive than the prelaunch predictions of Rigby et al. (2022). But in addition, the detection of the faintest galaxies in the LW images is surely aided by the fact that a significant fraction of the faintest galaxy sizes no longer exceeds the size of the PSF FWHM in the LW filters. The tendency of faint galaxies to bunch up against the HST diffraction limit at brighter flux levels was first suggested based on the Hubble Deep Field images by Odewahn et al. (1996) and Windhorst et al. (1998), and later by Welch et al. (2022c), Windhorst et al. (2021), and references therein based on more recent HST images.
In conclusion, at the FWHM of the NIRCam PSFs delivered by the JWST Project, faint galaxies with flat SEDs are noticeably easier to detect in the LW filters compared to the SW filters. Late-type stars are bluer than galaxies and are point sources in all NIRCam filters, so this PSF-advantage at longer wavelengths for galaxies does not apply to stars. Current and future JWST surveys that search for high-redshift dropouts and other red objects will need to keep this rather strongly wavelength-dependent sensitivity to the typical faint-galaxy sizes into account.
4.5. The Combined 0.9–4.5 μm Galaxy Counts
1. The PEARLS 0.9–4.5 μm Galaxy Counts: our first PEARLS galaxy counts are based on the data in two of our four fields observed so far with the best available data in Table 1. We used all 10 NIRCam detectors in the JWIDF plus the four SW and one LW detector in the El Gordo noncluster module. A comparison of the two sets of galaxy counts in the four filters where they overlap then enables us to quantify whether the El Gordo noncluster module was biased in a measurable way by the presence of the z = 0.870 cluster in the adjacent NIRCam module. We defer reporting galaxy counts in the VV 191 field to a later paper, owing to the presence of the two large, targeted galaxies and bright objects in the same nearby galaxy group that cover some of the other detectors. We also do not present object counts in the five medium-band filters of the TNJ-1338−1942 protocluster at z = 4.1 because these medium-band images are shallower than the broadband images in Table 1 and because there are no reference filters available from the ground for comparison to brighter object counts. Nonetheless, we did carry out their star–galaxy classification and object counts, as was done for the JWIDF and El Gordo in Figures 6–8, to check on the reliability of our procedures and to report their 5σ point-source sensitivities in Table 1 as compared to the ETC predictions.
We also inspected all 18 ≲ AB ≲ 21 mag objects in the noncluster field of El Gordo and found 10 galaxies close to the cluster outskirts that were in the noncluster module and have colors very similar to the El Gordo cluster galaxies. These are likely part of the outskirts of El Gordo. We removed these 10 objects from the galaxy counts. The galaxy counts in the JWIDF and El Gordo noncluster module at the JWST bright end (18 ≲ AB ≲ 20 mag) are consistent to within their (large) error bars and are close to the average counts from the previous ground-based, HST, and Spitzer surveys, which have much smaller error bars over this magnitude range. In any case, the error bars on the bright end of the JWST galaxy counts (18 ≲ AB ≲ 20 mag) are large enough that they do not weigh significantly into the spline fits of the galaxy counts (middle and right panels of Figures 9–10).
Our PEARLS galaxy counts in the JWIDF and El Gordo noncluster module are shown in Figures 9–10. These are based on our object catalogs of Section 4.1 with objects identified as stars removed (Sections 4.2–4.3). Error bars reflect the statistical uncertainties in the remaining galaxy counts. At the bright end (AB ≃ 18–21 mag), larger discrepancies are seen in the counts between the two fields due to the uncertainties in the star–galaxy classification procedure (Section 4.2–4.3) and due to cosmic variance. Because we used two NIRCam fields far apart in the sky, their cosmic variance is expected to be ≲9% (e.g., Driver & Robotham 2010, and Section 2.1 above). This estimate uses the JWIDF+El Gordo survey area of Table 1 and the redshift distribution expected for NIRCam objects with 18 ≲ AB ≲ 28 mag, assuming most objects are in the redshift range 0.3 ≲ z ≲ 8. Further details are given in Appendix B.2. For the brighter fluxes of 18 ≲ AB ≲ 21 mag, CV can be as high as 20% for redshifts 0.1 ≲ z ≲ 1, explaining some of the remaining statistical variations seen at the bright end of the counts in Figures 9–10.
The bright end of the 0.9–4.5 μm JWIDF and El Gordo counts in Figures 9–10 are consistent with each other to within their error bars. Hence, we see no evidence that the galaxy counts in the El Gordo noncluster module are significantly higher than those in the JWIDF, which is a random survey field. We will thus proceed with the JWIDF and El Gordo noncluster module counts as representative for the 0.9–4.5 μm galaxy counts, and will use a CV error of ∼9% in our discrete IGL error budget over the entire magnitude range of 18 ≲ AB ≲ 28.5 mag in Figures 9–10.
A few more objects may reside in the large-scale structure associated with the El Gordo cluster at z = 0.870. These may be removed from the galaxy counts in the El Gordo noncluster module when more spectra of the cluster and its surroundings become available. Future work will improve the accuracy of galaxy counts when done over more JWST fields. Given the high surface density of background galaxies detected by NIRCam and the negative magnification bias predicted by the shallow NIR count slopes in Figures 9–10, more accurate background-galaxy counts combined with a weak shear analysis of the same images may improve mass profile measurements of the galaxy clusters (e.g., Umetsu et al. 2011).
2. Comparison to Previous Galaxy Counts at 0.9–4.5 μm: the PEARLS 0.9–4.5 μm galaxy counts are compared to those at brighter levels from the combined GAMA (Driver & Robotham 2010; Driver et al. 2011, 2022) and DEVILS (Davies et al. 2021) surveys at similar wavelengths in Figures 9–10 and at the shorter wavelength (0.9–1.6 μm) also with the deepest available HST counts. A possible check of catalog completeness and reliability is to compare our JWST/NIRCam object counts to the deepest available HST counts in the same or similar filters and see whether the agreement is good to within the known ZP, rms counting, and cosmic-variance errors. This will also help verify the flux level at which catalog incompleteness sets in.
The GAMA and COSMOS/DEVILS survey data were compiled over a wide range of wavelengths by (Driver et al. 2016a, and references therein), building on the GAMA panchromatic data release of Driver et al. (2016b) and the COSMOS data as reanalyzed by Andrews et al. (2017). This compendium was later extended by Davies et al. (2018) and Davies et al. (2021) as part of the DEVILS survey, while Bellstedt et al. (2020a) extended the GAMA data to also include the ESO VST KiDS data. These updates were reported by Koushan et al. (2021), whose work forms the basis of the galaxy-counting data used here. These compendia also include the ESO K bands counts of Fontana et al. (2014), deep Spitzer 3.6 and 4.5 μm counts (e.g., Ashby et al. 2009, 2015; Mauduit et al. 2012), and the WISE counts of Jarrett et al. (2017). The typical combined ZP uncertainties in the combined GAMA+DEVILS surveys in the z band to K band are 2%–3% after bringing the flux scale in every filter onto the flux scale of the VISTA survey filters, which incorporated the GAMA and DEVILS surveys (Table 4 of Koushan et al. 2021).
The deepest panchromatic HST ACS+WFC3 galaxy counts come from the combined HUDF images, whose database has grown considerably over time since the launch of WFC3 in May 2009 (see e.g., Windhorst et al. 2011; Koekemoer et al. 2013; Rafelski et al. 2015, and references therein). Following the rich HUDF database summarized in these papers, the panchromatic galaxy counts were once more repeated on the deepest available HUDF images in 2015 with the same procedures as in Sections 4.1–4.2 and were included by Driver et al. (2016a) and Koushan et al. (2021). This deepest 2015 realization of the HUDF counts is listed in the legend of Figures 9–10 as "(Windhorst et al. 2011; +)" and follows the same methods. The ZP errors in the HST ACS, WFC/UVIS, and WFC3/IR images over the decades resulted in flux scales accurate to 1%–3% as summarized in Section 4.1.5 and Table 6 of Windhorst et al. (2022), i.e., comparable to or slightly better than the 2%–3% ZP accuracy of the VISTA filters of Koushan et al. (2021).
To within these ZP errors, our 0.9–1.5 μm PEARLS galaxy counts that come from shallow NIRCam exposures are consistent with the deeper HUDF counts in the HST ACS and WFC3/IR filters F850LP, F105W/F125W, and F160W (green open circles in Figures 9–10). It is important to realize that our PEARLS galaxy counts come from 1890–3157 s NIRCam exposures in the F090W, F115W, and F150W filters and reach ∼28.5 mag (Table 1), while the HUDF galaxy counts reach ∼29.5–28.5 mag in ∼156–87 HST orbits (≃117–65 hr of net exposure time; Beckwith et al. 2006; Koekemoer et al. 2013) in the F850LP, F105W/F125W, and F160W filters, respectively. Compared to the total HUDF ACS exposure time of 421.6 ks in F850LP, JWST NIRCam thus reaches approximately ∼5× deeper per unit time in its F090W filter, while compared to the total HUDF WFC3/IR exposure time of 236.1 ks in F160W, NIRCam reaches about ∼9–11× deeper per unit time in its F150W filter, respectively. In the light of the discussion in Section 4.4, this is an impressive performance improvement, especially because NIRCam was optimized for performance longwards of 2.0 μm.
Because our PEARLS 0.9–4.5 μm galaxy counts are done in NIRCam filters whose effective wavelengths and bandpasses can be somewhat different from the VISTA, GAMA, and DEVILS surveys, Appendix B.2 addresses whether additional corrections to the NIRCam flux scale are needed to compare the galaxy counts in similar filters. For this, we used the fiducial flux scale of the VISTA filters into which the GAMA and DEVILS surveys were anchored (Koushan et al. 2021). Appendix B.2 shows that the corrections needed to transform the NIRCam AB-mag scale onto the fiducial VISTA/IRAC filters are ≲3%–4% with combined uncertainties of ≲3%–6%, and therefore no corrections to the NIRCam AB-mag scale needed to be applied when plotting the results in Figures 9–10. However, we folded this ≲3%–6% uncertainty into our error budget of the 0.9–4.5 μm IGL of Section 4.6. We now have all the ingredients in place to compare our 0.9–4.5 μm NIRCam galaxy counts to previous work at brighter levels and can do so without further wavelength dependent ZP corrections.
3. The Faint-end Slope of the Combined 0.9–4.5 μm Galaxy Counts: Figures 9–10 compare our PEARLS 0.9–4.5 μm galaxy counts to previous work summarized above and extend it to AB ≲ 29 mag over this wavelength range. Over the AB ≃ 16–29 mag range for which they are available at 0.9–4.5 μm, the Yung et al. (2022) models are consistent with the combined GAMA/DEVILS ground-based, Spitzer/WISE, and our PEARLS NIRCam galaxy counts. The faint-end slopes of our observed galaxy counts have an average value γ ≃ 0.23 ± 0.04 dex mag−1 for 22 ≲ AB ≲ 29 mag, where the counts are a nearly straight power law (Figures 9–10, Table 3). The middle panels of Figures 9–10 showing the 0.9–4.5 μm IGL energy counts were derived from the left panels by dividing by the 0.4 slope. The spline extrapolations (gray lines and error fans) in the middle panels show that energy counts are clearly converging at all these wavelengths. The resulting IGL integral is shown in the right panels of Figures 9–10. Under the assumption that the faint galaxy counts at AB ≳ 29 mag continue as a power law with the same slope as observed for AB ≃ 22–29 mag, these spline extrapolations will form the basis of our IGL values used in Sections 4.6 and 5. Further details on the faint-end slope of the galaxy counts and its wavelength dependence are given by S. Tompkins et al. (2022, in preparation).
A magnitude slope γ ≃ 0.23 mag dex−1 corresponds to a faint end slope α ≃ − 1.58 ± 0.1 in flux units, where α =− 1 − 2.5γ. Ground-based spectroscopic surveys with VLT/MUSE and the spectrophotometric survey 3D-HST with Hubble suggest that faint galaxies with AB ≃ 23–29 mag have a median redshift in the range zmed ≃ 1–2 (e.g., Skelton et al. 2014; Inami et al. 2017) with the caveat that the completeness of these surveys becomes more difficult to quantify at fainter magnitudes. Around this median redshift, the faint end of the galaxy counts samples the power law part of the Schechter luminosity function (LF), which also has a faint-end flux slope α ≃ − 1.4 to −1.5 at z ≃ 1.5 (e.g., Hathi et al. 2010; Finkelstein 2016). In conclusion, over the AB ≃ 22–29 magnitude range sampled by our 0.9–4.5 μm NIRCam images, the PEARLS galaxy counts have a slope consistent with the faint-end slope of the Schechter LF at the median redshift sampled by these objects. Fainter JWST galaxy counts would then be expected to continue with the same slope, if the LF over this redshift range were to continue with the same slope toward fainter luminosities. Upcoming ultradeep JWST NIRCam GTO surveys (M. Rieke PI) are designed to cast light on this issue.
4.6. Characteristics of the Integrated Galaxy Light at 0.9–4.5 μm
The parameters that best characterize the 0.9–4.5 μm galaxy counts and integrated galaxy light are summarized Figure 11. The errors on these parameters are summarized in Table 3 for each filter as the quadratic sum of the NIRCam ZP uncertainties from Appendix B.1, and the uncertainty in bringing the flux scale of the NIRCam filters onto the effective wavelengths of the VISTA/IRAC filters used as fiducial for the galaxy counts (Section 4.5). Some interesting trends can be seen in the galaxy counts over the wavelength range 0.9–4.5 μm from Figures 9–10. (These trends are best seen if all PNG files of Figures 9–10 are shown on a computer screen at high magnification in rapid succession—all panels are plotted at exactly the same scale for this purpose.) The smooth behavior of the data in Figure 11 suggests that these trends in the IGL are real and meaningful.
- 1.The left panels of Figures 9–10 all show a clear change in slope from a steep nonconverging slope (≥0.4 dex mag−1) to shallow and converging slope (<0.4 dex mag−1). This change sets in around AB ∼ 19.3–20.3 mag at 0.9–4.5 μm (top panel of Figure 11). This peak AB-mag is the flux level where most of the IGL is generated, and is a clear function of wavelength.
- 2.In more detail, the normalized differential counts reaches the highest SB-level around 2–3 μm wavelength, and declines to both longer and shorter wavelengths (first and second panel of Figure 11, where the second panel shows the peak SB-value of the IGL at the AB-magnitude peak of the top panel).
- 3.The magnitude range over which most of the IGL is generated (here called the "IGL FWHM" and measured as the interquartile 25%–75% range of the middle panels in Figures 9–10) decreases from ∼4.5 mag at wavelengths ≲1.25 μm to ∼3 mag at 4.5 μm (third panel of Figure 11). This reflects the luminosity function and redshift distribution of the older, earlier-type galaxies that dominate the 3.5–4.5 μm galaxy counts. These filters sample the rest-frame ∼1.5 μm peak in the stellar emission of early-type galaxies as caused by their stellar mass distribution at z ≃ 1–2. The JWST images at these wavelengths are visibly dominated by earlier-type galaxies. At shorter wavelengths, we sample a larger fraction of galaxies of later-types, which have a wider range of ages and extinction, and extend to lower luminosities and redshifts, causing their larger contribution to the IGL at bluer wavelengths (e.g., Driver et al. 1995, 2016a; Andrews et al. 2018; Koushan et al. 2021). This can be seen in the larger IGL-width at bluer wavelengths in the third panel of Figure 11.
- 4.The discrete IGL with the highest energy (in units of nW m−2 sr−1) comes from wavelengths between 1 and 2 μm, as shown in the bottom panel of Figure 11. These are derived from the converging integrals from the right panels of Figures 9–10, and are the values we plot in the last Figure of Section 5, which provides further discussion of the total IGL and diffuse light.
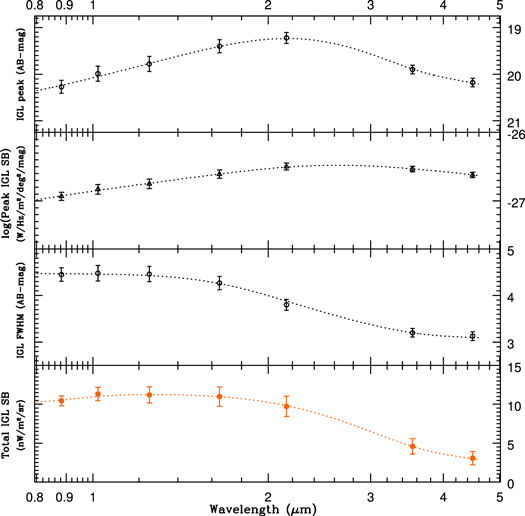
Figure 11. Parameters of the 0.9–4.5 μm galaxy counts and integrated galaxy light (IGL) as derived from Figures 9–10. The top panel shows the AB-magnitude level at which the normalized differential counts peak (see middle panels in Figures 9–10). This is where most of the discrete IGL is generated at each wavelength. Second panel shows the peak SB-value of the IGL derived from the middle panels of Figures 9–10. Third panel shows the width around the peak magnitude or interquartile (i.e., 25%–75%) range where 50% of the discrete IGL is generated. We refer to this range as the "IGL FWHM." The bottom panel shows the total IGL values (in units of nW m−2 sr−1) of the converging integrals in the right panels of Figures 9–10. Error bars were determined by combining the NIRCam ZP uncertainties of Appendix B.1 with the uncertainties in transforming the NIRCam flux scale to the fiducial flux scale of the VISTA/IRAC filters in Appendix B.2 (see Sections 4.5–4.6).
Download figure:
Standard image High-resolution imageThe new JWST results are most noticeable at the faint end of the AB-magnitude scale plotted in Figures 9–10. The bright end of the galaxy counts can be—and has been—done from the ground (i.e., the z, Y-, J-, H-, and K-band filters) or from space with WISE and Spitzer at L (3.5 μm) and M band (4.5 μm). Nevertheless, JWST NIRCam and also HST WFC3/IR below 1.6 μm have unique filters that are valuable for object counts. These include WFC3 F140W, and NIRCam F277W and F410M, as well as the other medium-band filters in Table 1. These filters have no ground-based counterparts because telluric water vapor blocks these wavelengths. Therefore bright-end galaxy counts to make a full energy integral as in Figures 9–10 are absent for the F277W and F410M as well as the medium-band filters.
Because of this, Carleton et al. (2022) had to interpolate the IGL integral in the WFC3/IR F140W filter from the adjacent WFC3/IR F125W and F160W filters, which have extensive ground-based coverage of the bright end counts. Fortunately, this is straightforward because the IGL SB is flat between 1.25 and 1.65 μm wavelengths (bottom panel of Figure 11). We therefore give low-order spline functions fit to the IGL parameters versus wavelength in Table 3 and plot these in Figure 11. We use these splines to interpolate the IGL SB-values for the JWST NIRCam F277W and F410M filters, which are tabulated as the PEARLS-IGL values in Tables 4–6. This includes the values beyond the PEARLS NIRCam detection limits of AB>28.5 mag, which were derived from the integrals in the right-hand panels in Figures 9–10. This allows us to estimate the IGL as a function of wavelength for the JWST filters at 0.9–4.5 μm wavelength, including the ≲2.5% of the IGL that is not included in our faint object counts to AB ≲ 28.5 mag (see Section 5.2 here and Section 3.4.3 of Carleton et al. 2022 for its procedure). Wider-area JWST surveys such as e.g., COSMOS-Webb (PI J. Kartaltepe) will become available during JWST's lifetime to improve the bright-end of the galaxy counts, as they have for HST ACS and WFC3 during the last two decades (e.g., Windhorst et al.2022).
5. NIRCam 13-band Sky-SB Estimates and Limits on Diffuse Light
In this section we give our estimates of the sky-SB as measured in between the detected discrete objects in the 13-band NIRCam filters observed with PEARLS, and assess if we can set meaningful limits to diffuse light in excess of the Integrated Galaxy Light from Section 4.6. In this process, we account for the NIRCam systematics summarized in Section 3 and Appendices B–C, and include these in our error budget.
5.1. JWST Sky-SB in the Context of Previous Diffuse Light Limits
JWST's ability to work continuously in a dark-sky environment makes it especially suitable for measurements of sky-SB. This is in contrast with HST, which at best gets complete dark time for at most ∼30 minutes of its 96 minutes orbit (e.g., Caddy & Spitler 2021; Caddy et al. 2022; Windhorst et al. 2022). Figures 12–13 summarize the astrophysical foreground and background energy relevant to PEARLS compared to recent data (as summarized by, e.g., Driver et al. 2016a; Koushan et al. 2021; Carleton et al. 2022) and IGL models (e.g., Andrews et al. 2018). Figure 13 shows the PEARLS discrete IGL measurements of Section 4.6 compared to those of D16 and Koushan et al. (2021). The IGL is the sum of the integrated (observed) galaxy counts (iEBL) and extrapolated galaxy counts (eEBL) derived in Section 4.5. The black line shown in Figure 13 is a modification of the Andrews et al. (2018) IGL model for accumulated star formation in spheroids (red dashed), disks (green dashed), and unobscured AGN (purple dashed lines). Here we have adjusted these contributing elements from the published Andrews et al. (2018) model, as described in the caption, to better fit the IGL data including the PEARLS points.
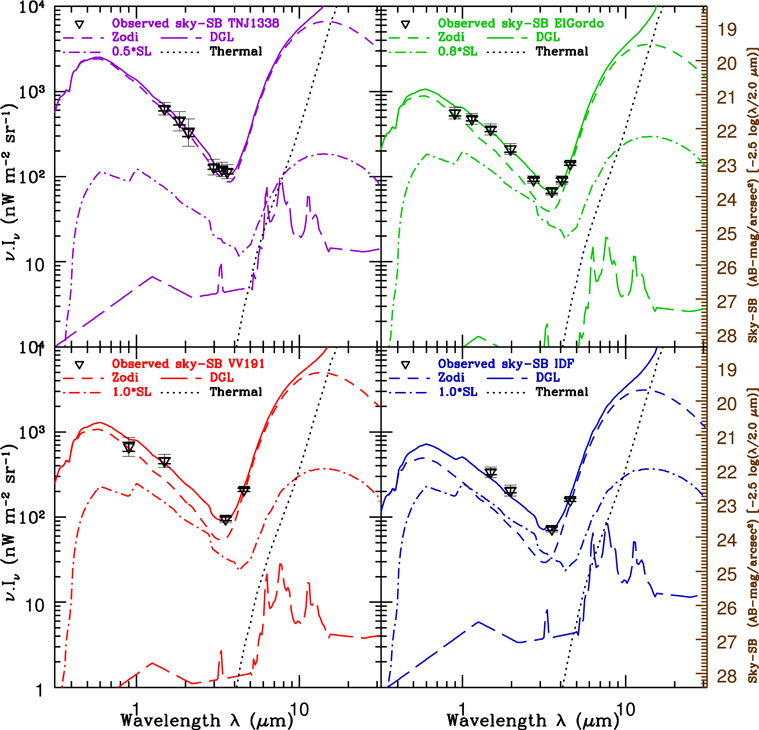
Figure 12. Comparison of the JWST NIRCam sky-SB values observed in our four PEARLS fields to models. Black triangles indicate the PEARLS sky-SB measurements of Section 5. The smaller (inner) error bars reflect the variation of the object-free sky-SB measurements within the NIRCam detectors, while the larger error bars reflect the median value of all sky-rms values across the images in each filter. These error bars include the ZP and other sky-SB uncertainties of Appendix B.3. Models are plotted for: TNJ1338 (upper left in purple), El Gordo (upper right in green), VV191 (lower left in red), and the JWIDF (lower right in blue). Short-dashed lines indicate the Zodiacal sky-SB from L2 as predicted by the Spitzer model (Appendix C). Zodiacal light is the highest amplitude component for all targets. Dotted–dashed lines indicate the JWST SL model from Figure 4 of Rigby et al. (2022); long-dashed lines indicate the DGL levels predicted by the IRSA model (Appendix C); black-dotted lines indicate the JWST thermal contributions to the sky-SB predicted by the ETC; solid colored lines are the sum of all four components. The SL level in each field was scaled down by factors f ≃ 0.5–1.0 compared to the Rigby et al. (2022) SL amplitude to obtain a best fit of the sum of the four model components to our 3.5–4.5 μm observations, where the sky-SB is lowest. Details are given in Section 5 and Appendix C.
Download figure:
Standard image High-resolution image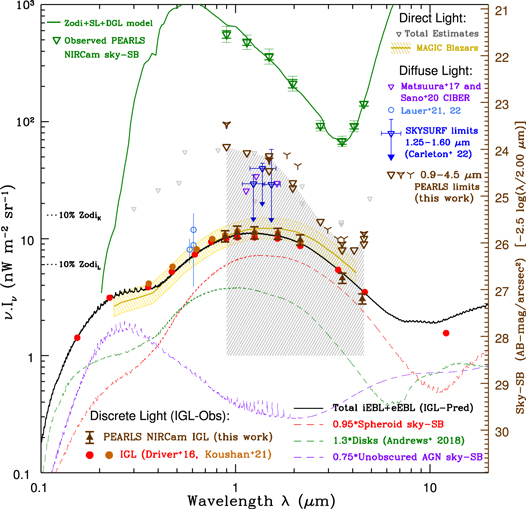
Figure 13. Summary of astrophysical foreground and background energy relevant to PEARLS. Dark brown filled upward-pointing triangles with error bars indicate the PEARLS NIRCam 0.9–4.5 μm IGL measurements of Section 4 (discrete light), and are lower limits to the total EBL. Dark brown downward-pointing triangles with the gray error wedge indicate our current JWIDF and El Gordo noncluster module 0.9–4.5 μm upper limits to diffuse light, with all known components subtracted (see error budget in Section 5 and Appendix C), and are in line with previous limits to diffuse light. (Brown starred and tripod symbols indicate the less accurate VV191 and TNJ limits.) Green triangles show our 0.9–4.5 μm PEARLS NIRCam sky-SB observations in the El Gordo noncluster module compared to the models of Section 5 and Figure 12 (green solid line). The left scale indicates the total energy ν. Iν in nW m−2 sr−1, and the right scale shows the corresponding sky-SB in AB-mag arcsec−2 at 2.00 μm (which can be scaled to other wavelengths as indicated). Filled circles show previous IGL counts of Driver et al. (2016a; red) and Koushan et al. (2021; orange). Solid and dashed colored lines show the (component and total) discrete EBL models from Andrews et al. (2018). The orange line and hashed area show γ-ray Blazar EBL constraints from the MAGIC TeV experiments (see, e.g., Dwek & Krennrich 2013, for a summary), and light gray triangles indicate total EBL estimates that require accurate modeling of DGL and ZL and still include the IGL (direct light). Purple triangles show the Matsuura et al. (2017) and Sano et al. (2020) CIBER estimates of diffuse light in excess of the Kelsall et al. (1998) model prediction. Dark blue upper limits are the SKYSURF 1.25–1.6 μm diffuse light limits from 34,000 WFC3/IR images of of Carleton et al. (2022) and Windhorst et al. (2022). Light blue circles with error bars at 0.61 μm are the Lauer et al. (2021, 2022) diffuse light estimates with New Horizons at 43–51 au. All diffuse light estimates plotted in color have the IGL (=iEBL+eEBL) already subtracted. See Carleton et al. (2022) for a discussion of possible causes of any remaining diffuse light.
Download figure:
Standard image High-resolution imageJWST was meticulously designed and built to have the darkest possible sky as seen from L2. Here we explore its capability to constrain potential levels of diffuse light. Windhorst et al. (2022) stated that over 95% of the 0.6–1.25 μm photons in the HST archive come from the Zodiacal light in the interplanetary dust (IPD) cloud, i.e., from distances <5 au. This can also be seen by comparing the typical Zodiacal light levels (green line) to the IGL counts in Figure 13. The Zodiacal/IGL ratio decreases significantly toward longer wavelengths in the 1.5–3.5 μm wavelength range. This is because the Sun is a zero redshift 5770 K G-star, and the IGL is the summation over multiple stellar populations, including hotter and cool stars, spanning a wide redshift range (e.g., Madau & Dickinson 2014). Longwards of 3.5 μm, thermal radiation from the Zodiacal belt and also from the JWST telescope and instruments make increasing contributions to the SB levels. The wavelength dependence of the diffuse light is precisely what JWST can explore from its first images, bearing in mind the significant JWST and NIRCam calibration uncertainties that we expect (Section 3.3 and Appendices B.1–B.3).
Obtaining diffuse light (DL) estimates requires accurate modeling of the Zodiacal light (ZL) and diffuse Galactic light (DGL). ZL can be ∼10–70× higher than the discrete iEBL+eEBL, dependent on the direction and time of observation (Figures 12–13). Constraints from previous work shown in Figure 13 suggest that there may exist some level of diffuse light at 0.6–1.6 μm, at a level of ∼8–30 nW m−2 sr−1. (Note that all diffuse light estimates plotted in color in Figure 13 have the full IGL already subtracted, and so truly represent the diffuse light levels or limits reported by various groups.) At this stage, it is not clear whether this diffuse light is due to residual instrumental systematics that have not been accounted for, a dim Zodiacal component (perhaps spherical or spheroidal) seen from 1 au that is not accounted for in the Zodiacal models, a truly diffuse EBL component, or some combination of these possibilities. For details on this topic, please see the discussions by, e.g., Conselice et al. (2016), Matsuura et al. (2017), Sano et al. (2020), Carleton et al. (2022), Korngut et al. (2022), Kramer et al. (2022), Lauer et al. (2022), O'Brien et al. (2022), and Windhorst et al. (2022), and references therein.
5.2. JWST Sky-SB Estimates and Possible Limits to Diffuse Light
Following Equation (2) of Windhorst et al. (2022), the sky-SB level between the detected objects is a sum of ZL, DGL, and residual instrumental systematics including thermal and straylight contributions. For JWST, that equation is:
The left term in Equation (3) is the total sky-SB that JWST observes as a function of wavelength λ, Ecliptic coordinates (lEcl, bEcl), Galactic coordinates (lII, bII), time of the year (t or Modified Julian Date), solar elongation angle (SA), and telescope and instrument temperatures, symbolized by T. The terms on the right side include: thermal (Th) signal from blackbody photons in the instruments and telescope that depends on wavelength and temperature; straylight (SL) that depends on wavelength, pointing direction, and observing date (Section 3.3); ZL as seen from L2 that depends on wavelength, Ecliptic coordinates, and observing date via its effect on the SA and on the path through the Zodiacal dust cloud (especially JWST's position above or below the Ecliptic plane; see Appendix C); DGL that depends on wavelength and Galactic coordinates; and any diffuse EBL (dEBL) that is not already included in the discrete object catalogs to AB ≲ 28.5 mag in Section 4, and therefore not yet masked out from our NIRCam images. This last term includes the part of the discrete IGL extrapolated for AB ≳ 28.5 mag (i.e., the eEBL), which is generally small and subtracted below.
At the start of JWST Cycle 1, we only have a limited number of JWST images and so can only explore limits for the sky-SB values observed from L2 thus far by PEARLS. When more JWST images become available, its full database can be studied following the SKYSURF methods of Carleton et al. (2022), who presented the HST sky-SB between discrete objects in 34,000 WFC3/IR images, and set constraints on diffuse light from the subset of HST 1.25–1.6 μm images with the darkest sky-SB values. At this stage, we will use our darkest available JWST images to explore what constraints can be made currently and how these may be improved in the future during JWST's lifetime.
We measured sky-SB in the NIRCam images following the SKYSURF procedures of Windhorst et al. (2022) and Carleton et al. (2022). In short, SKYSURF removes the light from all detected objects from the WFC3/IR images even in short HST exposures ( ≃ 500 s) to a total-object flux limit of AB ≲ 26.5 mag at 1.25–1.6 μm wavelengths. For JWST NIRCam, we used the same codes to remove the light from all detected objects (Section 3.3 and Appendix B.3) to AB ≲ 27.5–28.5 mag at 0.9–4.5 μm given the detection limits in Table 1, at which flux levels ≳97.5% of the discrete IGL is already detected in the JWST images, as the right panels of Figures 9–10 show. Details on the uncertainty in the estimated sky-SB are given in Appendix B.3.
Tables 4–6 summarize the JWST NIRCam instrumental and astronomical background levels as predicted from, or actually observed from L2 for each of the four PEARLS targets observed as of 2022 July 31. Background components are assumed to be uniform across the field of view but depend on wavelength. Tables 4–6 list the ETC predictions for the L2 Zodi, thermal and straylight, as well as the straylight level of Rigby et al. (2022; using their Figure 5). Details on these predicted sky-SB component values and their uncertainties are given in Appendix C, and we summarize aspects relevant to current discussion here. The sky-SB predictions for all these components and their uncertainties (where relevant) are given in Tables 4–6, and include:
- 1.
- 2.The L2 model prediction for the Zodiacal sky-SB for each target. This was based on the position and orientation of JWST at the actual time of the observation. These are based on the Kelsall et al. (1998) model, but for the Zodiacal cloud geometry for L2 as seen by JWST at the time of the observation. These predictions are uncertain by at least ∼9%–4% of the dimmest Zodiacal sky-SB observed over the range 1.25–4.5 μm, respectively.
- 3.The IPAC IRSA prediction for the DGL value at the Galactic coordinates of the target. The DGL is generally a factor of 20–100× lower than the total predicted JWST sky-SB, and uncertain by up ∼0.3 dex.
- 4.The actual straylight, which Rigby et al. (2022) noted is likely lower than the preflight predictions. Indeed, using the full Rigby et al. (2022) SL values would make the total sky-SB predictions from Equation (3) exceed the observed values in two of our PEARLS fields in Tables 4–6. As discussed above, the 0.9–3.5 μm Zodiacal component is caused by sunlight scattered off the Zodiacal dust cloud components, and may have been underestimated in some of the models. The 3.5–4.5μm sky-SB is dominated by the thermal contribution from the Zodiacal dust cloud components, while the telescope+instrument thermal components are still negligible in these filters. The thermal Zodiacal Light at λ ≳ 3.5 μm was the key component to be modeled by Kelsall et al. (1998) for their COBE/DIRBE analysis. The minimum sky-SB is predicted to occur around 3.5 μm in wavelength (Figures 12–13), so we will assume that: (a) the thermal Zodiacal components at λ ≳ 3.5 μm are more accurately predicted than the scattered sunlight components at λ ≲ 3.5 μm; and (b) the predicted thermal Zodiacal components should match the values observed at 4.5 μm without exceeding those observed in the minimum at 3.5 μm. Any truly diffuse astrophysical source is expected to be much dimmer than this, so we do not expect it to significantly affect our fitting. In order to not exceed the observed PEARLS sky-SB values, we then find that the implied SL values are generally f ∼ 50%–100% of the Rigby et al. (2022) SL values, with an uncertainty in f of at least ∼20% in Equation (4) below (see also Appendix C). With these adopted SL values in Tables 4–6, our total predicted JWST sky-SB matches the observations in all 13 PEARLS filters in Figure 12 to within the uncertainties summarized above, using Equations (4)–(5) below.
- 5.We use the IGL integral for the seven fiducial filter wavelengths in Section 4.5 from Figures 9–10. For the NIRCam wavelengths for which a full IGL integral is not yet available (F277W, F410M, and the medium-band filters), we used the spline predictions at those wavelengths from Figure 11. The IGL is assumed to be constant across the sky, and therefore to be the same for each PEARLS target. The extrapolated discrete eEBL (eEBL) of objects currently undetected in the JWST images for AB ≳ 28.5 mag is derived from Figures 9–10 (Section 4.6). The extrapolation for AB ≳ 28.5 mag typically amounts to ∼2.5% of the total IGL. This is the only part of the IGL that still need to be subtracted from the sky-SB, as our method already automatically removes ∼97.5% of the light from all brighter objects detected by NIRCam to AB ≲ 28.5 mag (see Carleton et al. 2022, for details). (Section 4.7 and Equation (3) of Windhorst et al. (2022) also corrected this fraction for SB incompleteness, which can be ∼40% at AB ∼ 28 mag, but the IGL correction for known objects at AB ≳ 28.5 mag remains very small.)
Our best prediction of the observed JWST Zodiacal sky-SB is then:
Tables 4–6 give this sum as predicted from the above models in all filters at the actual time of PEARLS observations. Finally, these tables list our upper limits to any DL as the difference between the observed JWST sky-SB "JWST(Obs)" and the total prediction of Equation (4) for L2:
The results from Equations (4)–(5) are listed on the bottom lines in each tier of Tables 4–6. This includes the full error budget of ∼6%–8% for JWST(Obs) in the LW–SW modules, respectively, from Appendix B.3, and the combined uncertainty of ∼10% in JWST(Pred) from Appendix C. The total uncertainty in the difference of Equation (5) is thus ∼12%–13% of the total sky-SB in the LW–SW modules, respectively, assuming that the observed and predicted sky-SB values are independent.
With our assumption that the total sky-SB model should fully predict the observed sky-SB values in the four PEARLS filters at 3.5–4.5 μm, the model predictions generally also match the observed sky-SB in the seven PEARLS filters at 0.9–3.5 μm, including the medium-band filters in TNJ1338, within the combined uncertainties. Therefore, to within the error budget of the current assessment, we have no firm detection of remaining DL by JWST NIRCam.
Accordingly, all our diffuse light constraints are plotted as upper limits using the combined uncertainties of Appendices B–C in Figure 13. Brown downward open triangles indicate upper limits from our deepest filter exposures in the JWIDF and the El Gordo noncluster field. Brown downward asterisk and tripod shape indicate the upper limits from the shallower TNJ and VV191 exposures. We excluded in this process the detectors that contained the overlapping nearby galaxy pair of Figure 5 and other large objects. Our PEARLS constraints in Figure 13 indicate upper limits to diffuse light captured by the gray-hashed area, and generally amount to 12%–13% of the total sky-SB observed by NIRCam. Within the current uncertainties in the JWST NIRCam calibration and in the total JWST sky-SB model, we cannot make firmer statements about the diffuse light as seen by JWST. In particular, if the JWST SL were even lower than we adopted here, firmer constraints on DL may be made. For this purpose, future work will require a more accurate assessment of the NIRCam calibration uncertainties, and more accurate models for the JWST straylight, the Zodiacal Light as seen from L2, and for the DGL.
The two JWIDF diffuse light points at 1.5 and 2.0 μm are marginally above the total model predictions in Figure 12(d). Our F150W and F200W NIRCam diffuse light limits in Figure 13 are in line with the 1.1–1.6 μm CIBER detections of Matsuura et al. (2017) and Sano et al. (2020; purple triangles in Figure 13), and with the SKYSURF upper limits in the HST/WFC3 F140W and F160M filters of Carleton et al. (2022). These papers, as well as Tsumura (2018) and Korngut et al. (2022), suggested that some very dim spherical—or nearly spherical—Zodiacal component could be missing from the Kelsall et al. (1998) model. Kelsall et al. (1998) also noted that a dim spherical Zodiacal component could have been missed in their model of the COBE/DIRBE data.
At the longer NIRCam wavelengths of 2.7–4.5 μm, the PEARLS DL limits in Figure 13 are lower in value, reaching as low as 8–12 nW m−2 sr−1, and consistently so between our four PEARLS fields within the current error budget. This is because the total sky-SB is significantly darker (Figure 12), and the total error budget of the LW modules (Appendix B) and the uncertainties in the sky-SB models are correspondingly smaller at 2.7–4.5 μm (Appendix C).
6. Discussion
It is remarkable how even the first JWST images of our PEARLS fields—with relatively short NIRCam exposures in a total of 13 filters—give us a fresh look on the distant universe. The fact that JWST achieved its diffraction limit at wavelengths well below 2.0 μm is a tremendous achievement for the JWST Project and of great value to the community. The JWST NIRCam PSF is so sharp and stable that star–galaxy classification is straightforward with existing methods, even in short exposures. The same is true for making object catalogs and deriving galaxy counts. At 0.9, 1.1, 1.5, 2.0, 3.5, and 4.5 μm wavelengths, comparison to existing ground-based, WISE, and Spitzer galaxy counts is also straightforward.
Our JWST galaxy counts of Section 4.5 agree well with previous work, but go ≳2 mag deeper even in our short NIRCam exposures. Combining two fields that are separated widely in the sky decreases the cosmic variance component of the uncertainty in the counts, which can be ≲9%, or more at brighter levels (e.g., Driver & Robotham 2010, see Section 2). The combined error in the counts from ZPs (≲4%), transforming to the VISTA/IRAC filters system (≲3%–6%), and CV (≲9%) is ≲10%–12% (Appendix C), which is our uncertainty in the IGL. The galaxy counts at 0.9, 1.1, 1.5, 2.0, 3.5, and 4.5 μm show some interesting trends. The energy-normalized differential galaxy counts reach a maximum in the range ∼19.3–20.3 AB-mag. Objects in this range produce most of the IGL per magnitude bin. The actual flux level in AB-mag and the width of the peak are both functions of wavelength. This reflects the luminosity function and redshift distribution of the galaxy population that dominates each of these wavelengths.
The galaxy population slowly changes from later-type galaxies at lower redshifts dominating in the blue (including the HST-unique wavelengths) to earlier-type galaxies at higher redshifts that dominate at 3.56 and 4.44 μm. Yet, not all of these galaxies are ellipticals, as discussed below. As the beautiful first NIRCam images already attest, JWST images will thus see a greater dominance of, and emphasis on, earlier-type galaxies, which will stand out the most in JWST images (e.g., Ferreira et al. 2022). This is in contrast to the "Faint Blue Galaxy" population of actively star-forming galaxies that have dominated HST's UV–optimally images for the past decades (e.g., Driver et al. 1995; Abraham et al. 1996; Windhorst et al. 2011). The morphology of nearby galaxies can be strongly wavelength dependent (e.g., Windhorst et al. 2002; Taylor-Mager et al. 2007; Mager et al. 2018, and references therein), especially for the earlier-type galaxies. We should therefore expect that JWST will put our studies of "old galaxies" in a new light, and provide the first glimpse of the first galaxies.
Our 3.5–4.5 μm IGL values in Figure 13 are somewhat below the Driver et al. (2016a) points, but not significantly so given the current error budget. As a consequence, to provide a best fit to the total PEARLS IGL in Figure 13, we needed to reduce the spheroid contribution in the Andrews et al. (2018) model to 95% of its value, and increase their disk component by 30% to match the 3.5–4.5 μm PEARLS points, while decreasing the unobscured AGN sky-SB to 75% of Andrews et al. (2018) model in order to not over predict the UV-optical IGL values of Driver et al. (2016a) and Koushan et al. (2021). To within the current uncertainties, these conclusions are not unique, but they may point to the need for a more significant fraction of red spiral galaxies at 3.4–4.5 μm, as other recent JWST work has suggested (e.g., Ferreira et al. 2022; Fudamoto et al. 2022). With the new NIRCam images now at hand, future IGL models may need to include a larger fraction of (dusty) spirals.
Our 3.5–4.5 μm PEARLS IGL values are ≲40%–50% below the direct EBL constraints in Figure 13 from MAGIC (e.g., Dwek & Krennrich 2013; Ahnen et al. 2015, 2016), which are estimated from how intervening EBL photons distort the γ-ray spectra of blazars over a range of redshifts. More recent γ-ray blazar results are converging closer toward the total IGL values (e.g., Fermi-LAT Collaboration et al. 2018). Various sources of diffuse light may cause a discrepancy between the IGL and the γ-ray constraints, as discussed by, e.g., Driver et al. (2016a), Windhorst et al. (2018), Carleton et al. (2022), and Windhorst et al. (2022), and references therein. A possible source of DL are tidal tails of long-lived stars pulled out in galaxy interactions over the entire redshift range where galaxy assembly happens. For instance, Ashcraft et al. (2018, 2022) analyzed ultradeep (32 hr) ground-based LBT U-band and r-band images at various stacked seeing-FWHM values, and find r-band tidal tails in galaxy pairs up to z ≲ 0.5–0.9. They suggest that ∼10%–20% of the galaxy light from brighter galaxies (AB ∼ 20–23 mag, which cause most of the IGL in Figures 9–11) may be at large radii to SB-limits of AB ≲ 31–32 mag arcsec−2. It is unlikely then that tidal tails between galaxies produce well over 20% of the IGL. Remarkably, though, JWST indeed sees tidal tails between galaxy pairs and groups in the CEERS images of Finkelstein et al. (2022), some of which can be also seen in our JWIDF image of Figure 2 here. If tidal tails consisting of older stars pulled out during galaxy interactions are common place, future JWST imaging should find many more such examples, and be able to better quantify the amount of DL present in dim tidal tails of faint galaxies. At the median redshift of these galaxies, NIRCam 0.9–4.5 μm images are ideal for such a study.
Our 3.5–4.5 μm PEARLS IGL values are a factor of ∼2–3 below our current PEARLS DL constraints, as shown in Figure 13. At our reddest wavelengths of 2.7–4.5 μm, our PEARLS diffuse light limits are about ∼8–12 nW m−2 sr−1, i.e., about the same level as the diffuse light level suggested by Lauer et al. (2022) at ∼51 au, who found a signal of 8 ± 2 nW m−2 sr−1 at 0.6 μm. If such diffuse light were caused by tidal tails or other stellar populations during the history of cosmic star formation, one may expect it to have a similar wavelength dependence as the IGL, or be redder, i.e., the diffuse light level seen by Lauer et al. (2022) would amount to ∼5–7 nW m−2 sr−1 at 3.5 μm. This is just below our current diffuse light limits, but higher than the PEARLS IGL values in Figures 11 and 13. When the JWST calibrations improve over time, and models for its total sky-SB predictions are improved, future work should be able to better assess how much truly diffuse light can be present in the infrared, and what its nature may be.
7. Summary and Conclusions
In this paper, we present an overview and describe the rationale, methods, and first results from the JWST GTO project "PEARLS." The following are our main highlights and results:
- 1.The first PEARLS NIRCam observations are those of the overlapping galaxy pair VV 191, the radio-selected protocluster at z = 4.1 around TNJ 1338−1942, the massive galaxy cluster known as El Gordo, and the IRAC Dark Field.
- 2.Star–galaxy classification, object-catalog construction, and galaxy counting are straightforward in the four fields observed so far (excluding the areas affected by VV 191, TNJ 1338-1942, and the El Gordo cluster itself).
- 3.The JWST galaxy counts at 0.9, 1.2, 1.5, 2.0, 3.5, and 4.5 μm wavelengths are consistent with previous ground-based, HST and Spitzer/WISE galaxy counts to within ≲10%–20%, given the combined error budget from ZPs, filter flux-scale transformations, and cosmic variance. Our PEARLS galaxy counts extend the previous work by ≳ 2 mag to AB ≲ 28.5–29 mag at 3.5–4.5 μm wavelengths.
- 4.The normalized differential galaxy counts, to first order and when normalized by the converging count slope of 0.4 dex mag−1, reach a maximum around AB ≃20 mag at wavelengths of 0.9–4.5 μm. This peak corresponds to the objects that produce most of the IGL. The PEARLS IGL converges to values within ≲10% accuracy at 0.9–4.5 μm.
- 5.Both the AB-magnitude at which most IGL is produced and the width over which the middle 50% of the IGL is produced depend on wavelength. This reflects the luminosity function and redshift distribution of the galaxy populations that dominate each wavelengths.
- 6.Our early JWST images, after removing discrete objects brighter than AB ≃ 29 mag, yield 0.9–4.5 μm diffuse light limits in good agreement with model predictions from Zodiacal light, JWST thermal and straylight, and DGL. After removing available model predictions for these components, and the small extrapolated contribution for galaxies fainter than 28.5 mag (eEBL), our images provide upper limits to the amount of diffuse light that may be present. Our best DL limits are in line with previous work at 1–2 μm and are lower in value at 2.7–4.5 μm wavelengths, because of the much lower total sky-SB and the correspondingly smaller uncertainties in both the NIRCam sky-SB data and the models at 2.7–4.5 μm. The search for diffuse light as part of the cosmic infrared background will become more accurate as JWST gathers many more images across the sky during its lifetime, and when its calibration and models of the L2 Zodiacal light and JWST's straylight levels improve.
- 7.During Cycle 1, PEARLS will provide NIRCam images, and some NIRISS grism or NIRSpec spectra, for another 12 targets, which will be done through 22 more pointings or epochs, as summarized in Table 2. v1 data products on the NEP TDF and other targets will become available as soon as we have them.
With the enormous new range in both flux and wavelength that the JWST images provide, the community will now have the resources to expand and deepen the study of the morphology, SED, star formation rates, masses, dust content, and extinction at redshifts extending to the epoch of first light, as well as better constrain how much diffuse light may be present in the infrared.
We dedicate this paper to Karin Valentine, who during her life as Media Relations Manager at the ASU School of Earth & Space Exploration was a true champion of outreach for NASA missions and was so eager to see the first JWST images. We thank the JWST Project at NASA GSFC and JWST Program at NASA HQ for their many-decades long dedication to make the JWST mission a success. We especially thank Tony Roman, the JWST scheduling group and Mission Operations Center staff at STScI for their continued dedicated support to get the JWST observations scheduled. We thank Scott Kenyon and John Mackenty for helpful discussions. We thank the referee and also Dr. Jane Rigby for very thoughtful suggestions that helped us improve the submitted manuscript. This work is based on observations made with the NASA/ESA/CSA James Webb Space Telescope. The data were obtained from the Mikulski Archive for Space Telescopes (MAST) at the Space Telescope Science Institute, which is operated by the Association of Universities for Research in Astronomy, Inc., under NASA contract NAS 5-03127 for JWST. These observations are associated with JWST programs 1176 and 2738. R.A.W., S.H.C., and R.A.J. acknowledge support from NASA JWST Interdisciplinary Scientist grants NAG5-12460, NNX14AN10G and 80NSSC18K0200 from GSFC. Work by R.G.A. was supported by NASA under award number 80GSFC21M0002. J.F.B. was supported by grant PHY-2012955 issued by the National Science Foundation. R.A.B. gratefully acknowledges support from the European Space Agency (ESA) Research Fellowship. C.C. is supported by the National Natural Science Foundation of China, No. 11803044, 11933003, 12173045, (in part) by the Chinese Academy of Sciences (CAS) through a grant to the CAS South America Center for Astronomy (CASSACA), and science research grants from the China Manned Space Project with NO. CMS-CSST-2021-A05. C.J.C. acknowledges support from the European Research Council (ERC) Advanced Investigator Grant EPOCHS (788113). L.D. acknowledges the research grant support from the Alfred P. Sloan Foundation (award number FG-2021-16495). K.J.D. acknowledges funding from the European Union's Horizon 2020 research and innovation program under the Marie Skłodowska-Curie grant agreement No. 892117 (HIZRAD). L.F. acknowledges funding from the Coordenaçao de Aperfeiçoamento de Pessoal de Nível Superior in Brazil (CAPES). L.F. acknowledges support by grant No. 2020750 from the United States-Israel Binational Science Foundation (BSF) and grant No. 2109066 from the United States National Science Foundation (NSF). B.L.F. thanks the Berkeley Center for Theoretical Physics for their hospitality during the writing of this paper. M.H. acknowledges the support from the Korea Astronomy and Space Science Institute grant funded by the Korean government (MSIT; Nr. 2022183005) M.I. acknowledges support from the National Research Foundation of Korea through grants 2020R1A2C3011091 and 2021M3f7A1084525. P.K. is supported by NSF grant AST-1908823. R.L.L. is supported by the National Science Foundation Graduate Research Fellowship under grant No. DGE-1610403. W.P.M. acknowledges that support for this work was provided by the National Aeronautics and Space Administration through Chandra Award Numbers GO8-19119X, GO9-20123X, GO0-21126X and GO1-22134X issued by the Chandra X-ray Center, which is operated by the Smithsonian Astrophysical Observatory for and on behalf of the National Aeronautics Space Administration under contract NAS8-03060. G.M. is supported by the Collaborative Research Fund under grant No. C6017-20G which issued by the Research Grants Council of Hong Kong S.A.R. M.A.M. acknowledges the support of a National Research Council of Canada Plaskett Fellowship, and the Australian Research Council Centre of Excellence for All Sky Astrophysics in 3 Dimensions (ASTRO 3D), through project number CE17010001. A.K.M. acknowledges support by the Ministry of Science & Technology, Israel. I.R.S. acknowledges support from STFC (ST/T000244/1). L.W. was supported by grant AST 1817099 issued by the NSF and grant 80NSSC20K0538 issued by NASA. C.N.A.W. acknowledges funding from the JWST/NIRCam contract NASS-0215 to the University of Arizona. J.S.B.W. was supported by the Australian Research Council Centre of Excellence for All Sky Astrophysics in 3 Dimensions (ASTRO 3D), through project #CE170100013. E.Z. acknowledges funding from the Swedish National Space Agency. A.Z. acknowledges support by the Ministry of Science & Technology, Israel, and by grant No. 2020750 from the United States-Israel Binational Science Foundation (BSF) and grant No. 2109066 from the United States National Science Foundation (NSF). We also acknowledge the indigenous peoples of Arizona, including the Akimel O'odham (Pima) and Pee Posh (Maricopa) Indian Communities, whose care and keeping of the land has enabled us to be at ASU's Tempe campus in the Salt River Valley, where much of our work was conducted.
Facilities: Hubble and JWST Mikulski Archive https://archive.stsci.edu - . Our specific GTO PEARLS - observations were retrieved from MAST at STScI - , and once they become public can be accessed via the following data sets: VV191:10.17909/dn6q-d483; IDF-epoch1:10.17909/z0aj-zm13; El-Gordo:10.17909/mw1y-gb32; TNJ1338:10.17909/7gez-0t67; TDF-spoke1:10.17909/d4w2-dz48.
Software: Astropy: http://www.astropy.org (Astropy Collaboration et al. 2013, 2018); IDL Astronomy Library: https://idlastro.gsfc.nasa.gov (Landsman 1993); Photutils:https://photutils.readthedocs.io/en/stable/ (Bradley et al. 2020); ProFound: https://github.com/asgr/ProFound (Robotham et al. 2017, 2018); ProFit: https://github.com/ICRAR/ProFit (Robotham et al. 2018); SourceExtractor: SourceExtractor: https://www.astromatic.net/software/sextractor/ or https://sextractor.readthedocs.io/en/latest/ (Bertin & Arnouts 1996).
Appendix A: NIRCam Pipeline Processing Details: 1/f Corrections
We investigated several schemes to remove the NIRCam 1/f noise effects caused by readout artifacts. Given the characteristics of the readout process and the visual discontinuities evident in the images, the optimal approach proved to be the following:
- 1.All pixels with data quality flag DQ = 0 are masked.
- 2.The brightest 10% of pixels are masked to filter out the real objects. Any number for masking between 10% and 30% works well in practice for a diversity of images (including, e.g., large galaxies in the field of view and extremely empty frames).
- 3.Each 2040 × 2040 calibrated frame is divided into four 510 × 2040 sections (i.e., shorter runs in the image x dimension).
- 4.In scan blocks of 512 × 1, the q = 0.4 quintile value is calculated ignoring all masked pixels above. This creates a vector of length 2040 for each of the four sections analyzed.
- 5.For each scan block vector of length 2040 the running median is computed with a window size of 101 pixels. This smooth distribution reflects large-scale structure we wish to preserve and is removed from the vectors. Window sizes between 51 and 201 pixels work well for the full diversity of images available.
- 6.Each vector is expanded along the x dimension to create 510 × 2040 sections. The four sections are then combined to create a single 2040 × 2040 1/f noise image. (See example in Figure 14(c).)
- 7.The final x-direction noise map is removed from the original image.
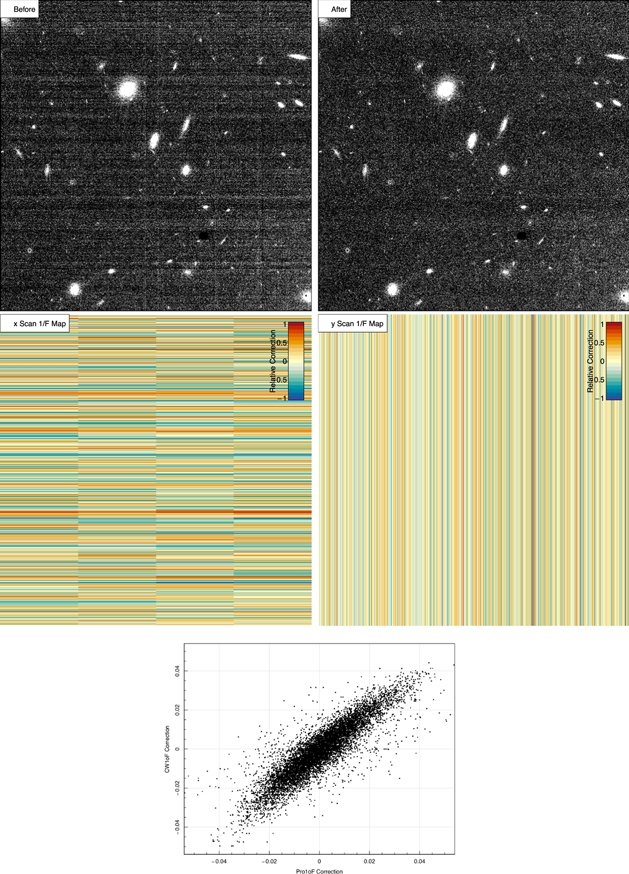
Figure 14. ((a) Top left): part of the JWIDF image before 1/f removal; ((b) top right): same part of the JWIDF image after 1/f removal with the ProFound-based 1/f subtraction code. (Please magnify these figures to see the details.) ((c) Middle left): row-wise 1/f pattern subtracted in the x-direction. The inset color bars show the relative level of the corrections applied. The imprint of the four 5512 × 2048 pixel sections read by the ASIC is apparent; ((d) middle right): column-wise pattern subtracted in the y-direction; ((e) bottom): comparison of the Willott 1/f-removal algorithm compared to the ProFound-based 1/f subtraction. The two algorithms leave similar noise imprints on the resulting sky-SB at the level of ≲0.02–0.04 MJy sr−1, where 1.0 MJy sr−1 typically corresponds to a 5σ source of AB ∼ 28 mag.
Download figure:
Standard image High-resolution image
A similar procedure is then carried out on the y-dimension except that the entire y-column is analyzed. (See example in Figure 14(d).) This noise pattern is also removed, creating our final 1/f-corrected frame. The above process is all run by the function profoundSkyScan that is part of the ProFound package (Robotham et al. 2017, 2018). For a particularly difficult frame, Figure 14(a) shows an image before 1/f removal and Figure 14(b) after 1/f removal.
Figure 14(e) shows a comparison of the Willott 1/f removal algorithm compared to the ProFound-based 1/f subtraction. The average effect of the 1/f correction is typically well below the pixel rms value. The rms of this particular image is 0.06 in units of MJy sr−1. The scatter away from the y = x line in Figure 14(e) shows that the two algorithms leave a residual noise imprint on the resulting sky-SB that differs at the level of ∼0.005 MJy sr−1, so that systematics resulting from the 1/f correction algorithms are ≲10% of the pixel rms level. Because 1.0 MJy sr−1 typically corresponds to a compact ∼5σ source of AB ∼ 28 mag (Equation (2) and Table 1), the 1/f-removal algorithms create ≲1% flux changes for the faintest sources in the field and substantially less for brighter sources. Also, the large scale structure of sources is preserved, and no discontinuities are present between scan regions, at least those not caused by the 1/f correction itself.
The one difference between the Willott and ProFound-based 1/f removal algorithms is that the Willott algorithm does not remove large-scale gradients, while the ProFound-based algorithm has the option to remove such gradients, although these are then preserved as a separate extension in the output fits files. As discussed in Section 4 of Windhorst et al. (2022), such large-scale gradients can be due to the real astrophysical scene (e.g., cluster ICL) and/or due to imperfections in the subtracted dark frames or color terms in the applied flat-field corrections. Large-scale gradients are seldom more than a few percent of the sky-SB across the image. Such gradients are in general not an issue for our purpose of constructing reliable, complete object catalogs for faint and small objects. We preserve the information on large-scale gradients when measuring the lowest estimated sky-SB (LES) following the methods of Windhorst et al. (2022) that we apply for our JWST sky-SB study of Section 5.
Appendix B: NIRCam Pipeline Processing Details: ZP Corrections and Error Budget
Appendix B.1 compares the results from our recent v1 calibration with the early Pipeline reductions. Appendix B.2, discusses if further corrections are needed to the NIRCam AB-magnitude scale in order to compare our PEARLS 0.9-4.5 μm galaxy counts to work done the last few decades at the fiducial wavelengths of the VISTA+IRAC surveys. Appendix B.3 summarizes the modeling of NIRCam sky-SB components and their uncertainties.
B.1. Comparison of the Early Pipeline Calibrations and jwst_0995.pmap_filters
JWST photometric calibration ("zero-point" or ZP) has to be established in flight and will evolve during the mission. Because standard-star observations were not available in time, the earliest JWST observations had to be calibrated with preflight ZPs. The MAST pipeline for NIRCam began using in-flight ZPs on 2022 July 27. At NIRCam wavelengths ≤2.0 μm, the on-orbit throughput was near prelaunch expectations (Rigby et al. 2022), but it was up to 10% smaller for some filters. At wavelengths >2.0 μm, the on-orbit throughput was about 15%–30% higher than the prelaunch expectations (Rigby et al. 2022; their Figure 8). Rigby et al. (2022) also wrote that the throughput stability is no worse than 4% and is likely much better.
With the new ZPs derived from on-orbit standard star observations in all NIRCam detectors and its main filters (Boyer et al. 2022), we reprocessed all our PEARLS images with jwst_0995.pmap_filters (Section 3). For the record, the results from our original processing with jwst_0916.pmap_filters through jwst_0952.pmap_filters are still available in the first submission of this paper on https://arxiv.org/abs/2209.04119, which also had a table of additional ZP corrections that this earlier processing required. The application of jwst_0995.pmap_filters has made these additional ZP corrections obsolete. It is nevertheless useful to give a brief comparison of the main differences between jwst_0995.pmap_filters (v1) and our earlier PEARLS images (v0.5):
- 1.The latest v1 calibration more accurately corrects for ZP variations between each of the 10 NIRCam detectors (typically by ≲10%–20% per detector). The improvement propagates into our images and science results although in a rather subtle way, because our previous processing already had averaged over 2–8 detectors and 2–4 fields. In general the change reduces the dispersions in the sky-SB values but does not reduce their medians very much, as described below.
- 2.The JWIDF has IRAC observations that allow direct comparison in two NIRCam filters. These IRAC observations were accumulated every two weeks over 15 yr and so are very deep (e.g., Yan et al. 2018). For unsaturated, isolated, and matched objects in the magnitude range 18 ≲ AB ≲ 20 mag in both sets of images, Source Extractor MAG_AUTO gives average total flux differences of F356W–IRAC1 ≃ –0.026 mag and F444W–IRAC2 ≃ –0.029 mag. Small differences between the JWST and Spitzer fluxes can be caused by a combination of filter differences, aperture corrections, and source confusion due to the vastly different PSFs of the two telescopes. The NIRCam PSF has a 2.362 ≃ 5.56× larger area in F444W compared to F090W (Table 1 and Figures 6–8). F444W also has a ∼140× smaller PSF area than the Spitzer IRAC2 filter. Despite these PSF differences, the 2022 October NIRCam F356W and F444W zero-points are consistent (within 2.6%–2.9%) with the deepest Spitzer images available.
- 3.The new calibration also tightened the dispersion between the resulting galaxy counts when compared to the brighter galaxy counts in the ground-based+HST+Spitzer filters and improved our estimates of the integrated galaxy light (Section 4), although these changes are well within the uncertainties quoted in Table 3 and hardly visible in Figures 9–11.
- 4.From the object-free sky-SB measurements in Section 5, we confirm that the ZPs of the NIRCam SW detectors have become ∼10%–20% more sensitive. That is, the ratio of 2022 August to October object-free sky-SB values is typically 1.09–1.22 for the NIRCam SW filters, while this ratio is typically 0.88–0.97 for the LW filters, which have thus become somewhat less sensitive compared to the earlier values. Such ZP changes can affect the colors of discrete objects, which we defer to future papers.
- 5.The new calibration has improved the rms variation between the sky-SB measurements compared to our earlier calibrations. Specifically, the relative errors on the object-free sky-SB values have significantly improved with the new calibrations, with the 2022 October to August ratios of these relative errors typically being a factor 0.63–0.83 for the SW filters and sometimes less than 0.5 for the LW filters. Stated differently, the new ZP calibrations and flat-field corrections have reduced the dispersion in the sky-SB estimates significantly, especially for the LW filters. As a consequence, our limits on diffuse light in Section 5 and Figure 13 have also improved, especially in the LW filters.
- 6.The more accurate detector-to-detector ZPs also improved the overall quality of our sky-SB model fits in Figure 12, as described in Section 5.2 and Appendix C. In particular, the range in scale factors f by which we needed to multiply our adopted Rigby et al. (2022) straylight in Equation (4) has increased from f = 0.3, 0.6, 0.8, 0.9 in our v0.5 reduction to f ≃ 0.5, 0.8, 1.0, 1.0 in v1, i.e., providing a tighter range in the predicted SL values for our four PEARLS fields. The SL spectrum, which we assumed to be constant other than this factor f, in fact somewhat depends on JWST's pointing direction (J. Rigby 2022, private communication; J. Rigby et al. 2022, in preparation). We refer to this work for an in-depth discussion of the JWST straylight. For the very red thermal Zodiacal SED (see Figure 5 of Rigby et al. 2022), the effective wavelength (Equation A15 of Bessell & Murphy 2012) of the F444W filter shifts from ∼4.4 μm for objects with relatively flat NIR-spectra like stars and galaxies to ∼4.57 μm for the total sky-SB, which we accounted for in Figures 12–13.
In conclusion, we independently confirm the Rigby et al. (2022) and Boyer et al. (2022) flux scale and adopt their suggested 4% uncertainty in the current JWST NIRCam flux scale in our error analysis below. While model dependent (Appendix C), our sky-SB analysis does give a nearly PSF-independent check on the zero-points, to the extent that the sky-SB is estimated in areas largely devoid of bright-object PSF-wings. The results from the new calibrations have also been propagated into the error budgets for our sky-SB values in Appendix B.3. The total uncertainties then are ≲8% for the SW filters and ≲6% for the LW filters (Appendix B.3).
B.2. Comparison of NIRCam AB-mag Counts to VISTA/IRAC Counts
In order to compare our PEARLS NIRCam 0.9–4.5 μm object counts in Figures 9–10 to previous work from ground-based telescopes and Spitzer/IRAC, the NIRCam flux densities may need to be transformed to the same flux scale as used for the filters in those previous surveys. The NIRCam filter wavelengths are similar, but not identical, to those used previously. The most extensive survey and number counts for λ < 3 μm is that of Koushan et al. (2021, and references therein), who combined many data sets. For λ > 3 μm, we use the compilation of Driver et al. (2016a, 2016b), who included number counts for AB ≲ 18 mag from WISE (Jarrett et al. 2017) and for 18 ≲ AB ≲ 26 mag from IRAC (Ashby et al. 2009, 2015).
Table 7 lists the effective wavelengths λc of the relevant VISTA/IRAC and WISE filters in which these previous counts were done, as displayed in Figures 9–10. We therefore use the effective wavelengths of the VISTA/IRAC filters in Table 7 as fiducial to compare our NIRCam object counts to. The flux scale of the WISE W1 and W2 filters was already transformed to the flux scale of these fiducial VISTA/IRAC filters. We used the ICRAR filter transform tool (Robotham et al. 2020) 81 to calculate the corrections needed to bring the NIRCam AB-magnitude scale onto that of the VISTA/IRAC filters that are closest in wavelength. The tool uses the filter and telescope transmission curves folded with the detector QE curves for a large number of facilities to perform numerical integration over a range of SEDs and redshifts, and produces AB-flux scale offsets, ΔAB, and their uncertainties, σΔAB, which we represent as:
The transformation requires an assumption for the redshift distribution of the galaxy population at AB ≃ 20–28 mag, for which we used a median redshift of zmed ≃ 1–2 (e.g., Skelton et al. 2014; Inami et al. 2017). The resulting values for ΔAB and σΔAB are given in Table 7. 82 For most filters, the uncertainty in the transformation is 3%–6%, i.e., similar to or larger than the actual flux scale correction needed, which is –0.04 to +0.03 mag. This is mainly because of the wide redshift range sampled. Therefore, no AB-mag scale corrections were applied to our PEARLS NIRCam number counts to compare them to the VISTA/IRAC counts. But we do add this uncertainty to our error budget.
Table 7 also lists the cosmic variance uncertainty for our two PEARLS fields used in the deep NIRCam galaxy counts thus far (Sections 2 and 4.5). Assuming both ZP uncertainties and the CV uncertainty are independent, we show the combined total error on the bottom line of Table 7. These are our IGL errors used in Figures 12–13. These errors are likely conservative, since other deep fields from HST, VLT and Spitzer fold into the galaxy counts of Figures 9–10 thereby reducing CV, except at the faint end of the counts at wavelengths ≳2.0 μm, where we only have NIRCam.
In summary, the uncertainty in the JWST NIRCam zero-points is at least 4%, while the uncertainty of transforming the NIRCam AB-mag scale onto the fiducial VISTA/IRAC filters that have been used for galaxy counts at brighter levels is ≲3%–6%. The combined uncertainty to compare counts that were done with slightly different filters systems on different telescopes is thus ∼3%–7%. Magnitude offsets of that size are hardly noticeable over the very wide magnitude range plotted in Figures 9–10. Future improvements in the NIRCam ZPs through further standard star monitoring and more detailed comparison to the fluxes in the fiducial VISTA/IRAC filters can provide a more accurate comparison, and observing more JWST fields will decrease the uncertainty in the counts from cosmic variance.
Table 7. ZP and Transformation Uncertainties of JWST NIRCam to VISTA System for Galaxy Counts/IGL
| NIRCam filter: | F090W | F115W | F150W | F200W | F277W | F356W | F410M | F444W |
|---|---|---|---|---|---|---|---|---|
| λc (μm) | 0.8985 | 1.1434 | 1.4873 | 1.9680 | 2.7279 | 3.5287 | 4.0723 | 4.3504 |
| NIRCam ZP uncertainty | 0.04 | 0.04 | 0.04 | 0.04 | <0.04 | <0.04 | <0.04 | <0.04 |
| VISTA/IRAC filter: | VISTA-Z | VISTA-J | VISTA-H | VISTA-K | ⋯ | IRAC-1 | ⋯ | IRAC-2 |
| λc (μm) | 0.883 | 1.254 | 1.648 | 2.154 | ⋯ | 3.544 | ⋯ | 4.487 |
| ΔAB | +0.026 | −0.006 | −0.044 | −0.003 | ⋯ | 0.001 | ⋯ | +0.018 |
| Transform uncertainty | 0.05 | 0.06 | 0.04 | 0.03 | ⋯ | 0.01 | ⋯ | 0.003 |
| Total ZP uncertainty | 0.06 | 0.07 | 0.06 | 0.05 | <0.04 | <0.04 | <0.04 | <0.04 |
| CV error | 0.09 | 0.09 | 0.09 | 0.09 | 0.09 | 0.09 | 0.09 | 0.09 |
| Total IGL error | 0.11 | 0.12 | 0.11 | 0.10 | <0.10 | <0.10 | <0.10 | <0.10 |
Note. The first tier of this Table lists the NIRCam ZP uncertainties from Appendix B.1 for each filter. The second tier lists the effective wavelengths of the VISTA/IRAC filters used as fiducial for the PEARLS NIRCam galaxy counts in Section 4.5. The third tier lists the correction ΔAB that would need to be added to the calibrated JWST AB magnitudes to bring them onto the same AB-scale as used for the VISTA (Koushan et al. 2021) and IRAC (Ashby et al. 2009, 2015) galaxy counts using the ICRAR filter transformation tool, together with its transformation error. The fourth tier lists the combined NIRCam ZP uncertainties and the ICRAR transformation error. The fifth tier lists the cosmic variance error expected for the 0.9–4.5 μm galaxy counts in our two current PEARLS NIRCam fields (Section 4.5). The bottom tier lists the combined fractional error, assuming all contributions are independent, and is used to assess the errors in our IGL parameters (Section 4.6).
Download table as: ASCIITypeset image
B.3. Uncertainties in the Observed NIRCam Sky-SB Estimates
For the uncertainties in our observed JWST NIRCam sky-SB values we need to consider other error sources than those that apply to the flux-scale errors in our galaxy counts in Appendix B.2. We wish to make an estimate of the absolute sky-SB in our 13 NIRCam filters, and so the main sources of error are different. For details of an assessment of this kind, we refer to Section 4 and Table 5 of Windhorst et al. (2022), where the sources of error in the absolute sky-SB as measured by WFC3/IR were summarized for the F125W–F160W filters. In short, their total errors in the estimated WFC3/IR sky-SB were 3%–4% in these filters, and dominated by the flat-field (≲2%) and ZP errors (≲1.5%). This was through careful tracking of the WFC3/IR performance and its calibration over 12 yr in orbit. At this stage, such errors for JWST are surely less well known, so we estimate our error budget by giving conservative limits to each main component that affects our estimated sky-SB values.
- 1.Algorithm to get LES: with the LES algorithm of Windhorst et al. (2022) and O'Brien et al. (2022), we divided the 2048 × 2048 pixel image from each individual NIRCam detector into 32 × 32 boxes of 64 × 64 pixels and used these to determine the lowest estimated sky (LES) values following the percentile clip method of (O'Brien et al. 2022). From Monte Carlo simulations with realistic object densities and CR distributions, they showed that the LES method gives reliable estimates of the object-free sky-SB, to within 0.4% of the simulated sky-SB, even in the presence of 10% gradients across the field. While the object density in the NIRCam images of Section 4.5 is ∼3× higher to AB ≲ 28.5 mag compared to the HST WFC3/IR image density at its detection limit of AB ≲ 26.5 mag, the NIRCam SW and LW pixel size is also ∼16–4× smaller in area compared to WFC3/IR, respectively, so that at least similar amounts of empty sky are available to the current depth in the NIRCam images to measure object-free LES sky-SB values. Hence we adopt an uncertainty of ≲0.4% of the algorithm itself estimates the sky-SB in the object free areas. When applying this algorithm, we find that it does ignore areas with residual wisps and snowballs well (as it flags those as potential objects with positive flux to be avoided in the sky-SB estimate).
- 2.ZP Uncertainties: The 4% NIRCam ZP uncertainties of Table 7 also apply to the observed sky-SB values of Figure 12. Since we plot all data points at their actual effective NIRCam wavelengths the Transform uncertainties of Table 7 do not apply. Most of the JWST sky-SB comes from the Zodiacal belt at distances ≲3–5 au (e.g., Windhorst et al. 2022), and the IGL is ∼10–70× dimmer than than the ZL (Figure 13). Hence, a ≲9% CV error in the IGL (Section 4.6) is very small compared to these other errors in the total sky-SB estimates.
- 3.Flat-field and residual 1/f and pedestal uncertainties: we verified that the LES algorithm of Section 5 and Windhorst et al. (2022) finds the cleanest regions to estimate the sky-SB in each detector after the 1/f corrections of Appendix A. With the most recent reduction of context file jwst_0995.pmap_filters, the flat field uncertainty has improved to ∼2% compared to the 7%–8% uncertainty in our earlier reductions with context file jwst_0942.pmap_filters (B. Sunnquist 2022, private communication). Since flat-field uncertainties can be a dominant component in our error budget for absolute sky-SB estimates, we check for this as following. We find that the LES sky-SB estimates have a ≲2%–4% variation between the LW detectors in our 2.7–4.5 μm filters, including our TNJ1338 medium-band LW filters. However, these variations increase to ≲4%–7% for between the SW detectors in SW 0.9–2.0 μm filters. This is likely due to the larger number of detectors, some of which still have residual offsets after the flat-fielding and pedestal removal procedure of Section 3.1. Hence, we adopt a 7% uncertainty in the flat-field induced sky-SB estimate for all SW filters, and a 4% uncertainty for all LW filters.
- 4.Bias and dark-current frame subtraction uncertainties: in the 12 yr on-orbit data analyzed for the WFC3/IR detectors, these errors were ≲1% following Section 4 and Table 5 of Windhorst et al. (2022). The NIRCam bias and dark-current levels and their uncertainties listed in Section 3.1 and its websites are also very low, typically ≲1.4%–2.1% of the sky-SB at 3.5–2.0 μm in Table 4, respectively. 83 Hence, uncertainties in the NIRCam dark-current removal are much smaller than the ZP and the flat field plus residual pedestal uncertainties above.
In summary, following the discussion of Windhorst et al. (2022), we will assume that the above errors in estimating the sky-SB are independent. This is justified because the standard stars from which the NIRCam ZP are derived are measured over an area much smaller than the above dominant flat-field/residual pedestal errors. The resulting uncertainty in our combined error on the absolute NIRCam sky-SB is thus ∼6% of the observed sky-SB for the LW filters and ∼8% for the SW filters. We propagate these errors for each filter and PEARLS field into the NIRcam sky-SB estimates of Tables 4–6 and Figure 13.
Appendix C: Thermal, Straylight, Zodiacal, and DGL Models to Interpret the JWST Sky-SB
In this section, we summarize the main components in the error budget when modeling the sky-SB values observed by JWST NIRCam from L2. The ETC output file ''backgrounds.fits'' contains an array in its second header which contains the predicted ETC-straylight, ETC thermal, and in-field ETC-Zodiacal components, as well as the combined ETC-total foreground, respectively. Where relevant, the uncertainties that we derived for these components below are listed in Tables 4–6 between parentheses on the lines directly below the model prediction for each component.
(1) Thermal Component: the JWST ETC provides predictions for the thermal contribution from its own components at their various temperatures. JWST component temperatures are monitored continuously. They are typically ∼42–45K for the OTE and 6–39 K for JWST's science instruments, 84 i.e., considerably colder and more constant than the varying ambient temperatures of HST across its orbit (see, e.g., Appendix A of Carleton et al. 2022). As a consequence, the Thermal values for JWST NIRCam in Tables 4–6 are predicted to be much lower than those for HST. The JWST thermal radiation is in fact more than 100× lower than the predicted total sky-SB even at 4.5 μm, as can be seen in Figure 12. JWST thermal sensors on the website above report typical NIRCam temperatures stable at 38.5 K to well within 1 K for many days after its initial cool-down period. We will thus adopt the ETC thermal sky-SB predictions for NIRcam, and assume that we may ignore its uncertainties in our total error budget as it is the smallest of all components. Note that this situation is quite different for HST, where some component temperatures remain at room temperature and can vary by ± a few K within an orbit, resulting in nonnegligible thermal dark signal in the WFC3/IR F160W filter (Carleton et al. 2022). As a consequence, JWST can make more accurate sky-SB observations that are less sensitive to thermal signal than HST and can do so at much longer wavelengths.
(2) Stray Light Model Prediction and its Uncertainty: the JWST SL model is created by ray-tracing the infrared sky from 2MASS and WISE onto JWST, and estimates the fraction of light that can make it onto the detector (Lightsey 2016). This depends on the dust deposition on JWST mirrors, which after launch appeared to be much smaller than the requirements (Rigby et al. 2022). This straylight is significantly out of focus, and to first order generates an elevated sky-SB onto the NIRCam detectors with a predicted overall spectrum. The uncertainty in the predicted SL amplitude is not well known from first principles. During its development, the JWST Project designed the telescope and sunshield with a requirement that the SL in general be ≲40% of the Zodiacal sky-SB at 2.0 μm wavelength. Figure 5 of Rigby et al. (2022) suggests that the JWST 1–5 μm SL may be substantially lower than this requirement. Hence, in Figure 12 we adopt the lower of the two Rigby et al. (2022) SL curves as our fiducial.
Because the uncertainty in the SL prediction is not well known, we will assume that at 3.5 μm—where the total JWST sky-SB in Equation (4) is lowest—the JWST sky-SB prediction JWST(Pred) should not exceed but match the observed sky-SB value JWST(Obs). We found that it was not possible to do this by assuming the full Rigby et al. (2022) SL as fiducial—in two panels of Figure 12 the predicted JWST sky-SB would be much higher than the observed NIRCam sky-SB values, if we assumed 100% of the Rigby et al. (2022) SL. We therefore allowed the fraction f in Equation (4) to vary, while assuming f ≲ 1.0. We then attempted to find the fraction f by which we need to multiply the lower Rigby et al. (2022) SL-value to get a best fit to our observed 3.5–4.5 μm sky-SB values in Tables 4–6. That is, we set f to produce the best match to the difference in JWST(Obs)–JWST(Pred) in Equation (5) at 3.5–4.5 μm using the sum in Equation (4).
For the TNJ1338, El Gordo, VV191, and JWIDF fields we find that the 3.5–4.5 μm JWST(Pred) values in Equation (4) best match the observed sky-SB JWST(Obs) in Tables 4–6 when we use multipliers for the Rigby et al. (2022) SL of f ≃ 0.5, 0.8, 1.0 and 1.0, respectively. We estimate that the f× SL values used in Tables 4–6 are uncertain by at least 0.2× the Rigby et al. (2022) SL itself. Based on this variation, we adopt 0.2× SL as the straylight error in our error budget in Tables 4–6. The f× SL values are generally a factor of 2–10× lower than the total predicted JWST sky-SB in Figure 12. Hence, the assumption of a straylight uncertainty of 20% of the total Rigby et al. (2022) SL value results in the JWST SL being the dominant uncertainty in predicting the JWST sky-SB, as shown in Tables 4–6.
(3) L2 Zodiacal Light Model Prediction and its Uncertainty: Zodiacal light intensities for PEARLS' JWST observations were calculated using the Spitzer background model. That model was derived from the Kelsall et al. (1998) model, 85 which was designed for the COBE/DIRBE observations from LEO. The Spitzer model updated the scattering component to increase the contrast between Ecliptic plane and poles and generalized the model to a wider and continuous range of wavelengths and to arbitrary locations in the Solar system, as needed for the slowly changing Spitzer position around the Sun compared to the Earth. This model includes the L2 location, which is ∼1,500,000 km from Earth. Details of this model are given on the IRSA website. 86 The Spitzer model was run using the ephemeris of JWST's L2 orbit from the ESA website 87 and the actual times of our PEARLS observations in Table 1. Figure 12 shows the resulting Zodiacal Light intensities as predicted for JWST's position in L2.
The Zodiacal-light brightness depends on not only on distance from the Sun but also on the density and temperature profiles of the IPD cloud and on the specific line of sight through the cloud. Solar elongation angle in particular is a significant factor. L2's distance from the Sun is on average ∼1% larger than the Earth's, but the other details matter for specific observations. Comparing the four PEARLS observations so far to what would have been seen in LEO, the scattered sunlight component was ∼1% fainter for El Gordo and TNJ1338 but ∼1%–2% brighter for VV 191 and the JWIDF. (A larger-than-average path length through the IPD cloud at JWST's south-of-ecliptic orbital position at that time probably explains the latter.) The thermal Zodiacal component at 3 μm was 3%–7% dimmer at L2 compared to LEO, but around ∼1.5 and 30 μm there was at most 2% difference. The larger difference at the shorter wavelengths occurs because the lower temperatures at the larger solar distance of L2 have a stronger impact on the Wien side of the thermal spectrum. Overall, the differences between L2 and LEO are modest.
Kelsall et al. (1998; their Table 7) reported uncertainties in their ZL model of 15 nW m−2 sr−1 at 1.25 μm, 6 nW m−2 sr−1 at 2.2 μm, 2.1 nW m−2 sr−1 at 3.5 μm, and 5.9 nW m−2 sr−1 at 4.9 μm, respectively. These come from their IPD-cloud modeling uncertainties. These uncertainties are also present in the Spitzer model predictions and correspond to Zodiacal model uncertainties at our NIRCam wavelengths in Table 1 of ∼11 nW m−2 sr−1 at 1.49 μm, ∼7 nW m−2 sr−1 at 2.0 μm, ∼2.2 nW m−2 sr−1 at 3.53 μm, and ∼4.1 nW m−2 sr−1 at 4.57 μm, respectively. At the darkest Zodiacal sky-SB measured in the JWIDF of ∼131 nW m−2 sr−1 at 1.49 μm, ∼76.7 nW m−2 sr−1 at 2.0 μm, ∼34.3 nW m−2 sr−1 at 3.53 μm, and ∼107 nW m−2 sr−1 at 4.57 μm, these L2 Zodiacal modeling uncertainties are ∼8%, ∼9%, ∼6%, and ∼4% at these four wavelengths, respectively. Blueward of the bluest COBE/DIRBE 1.25μm filter, the Zodiacal sky-SB values predicted for the NIRCam F115W and F090W filters are less reliable and should be viewed with caution. Our four PEARLS fields observed so far span a wide range of ecliptic latitudes, and therefore the Zodiacal sky-SB differs significantly among the fields. These differences are much more than the adopted 4%–9% uncertainties here, as shown in Figure 12. We fold these L2 Zodiacal model uncertainties into the total error budget to predict the NIRCam sky-SB in Section 5.
(5) Diffuse Galactic Light Model Prediction and its Uncertainty: the DGL intensities for each PEARLS target came from the Spitzer IPAC IRSA model prediction (where it is referred to as "ISM"), 88 as discussed by Carleton et al. (2022, and references therein). The work of Sano et al. (2016), Sano & Matsuura (2017), and Onishi et al. (2018) has suggested that the DGL as derived from the IRSA model of Brandt & Draine (2012) can be uncertain by a factor of two. Hence, in our error budget will include an DGL uncertainty of ±0.3 dex in the predicted JWST(Pred) values used in Equation (4) in Tables 4–6. The DGL is generally a factor of 20–100× lower than the total predicted JWST sky-SB in Figure 12, so that a factor of two DGL uncertainty is not the dominant error in predicting the total JWST sky-SB. The IRSA model predicted the highest DGL for TNJ1138 among all our PEARLS targets, in fact so high that zero SL would be required for TNJ1138, which seems unrealistic. Assuming that the IRSA DGL prediction is too high by 0.3 dex for this field alone, we adopt this lower DGL value, in which case still only a ∼0.5× SL level is required in Figure 12(a). In any case, the Zodiacal level in the TNJ1138 field is the brightest of all PEARLS fields, about 10× higher than the nominal SL and ∼10–100× higher than the DGL prediction. This illustrates the limitations of our current assessment. Better SL and DGL models are needed to more accurately predict JWST NIRCam's observed sky-SB levels in future work.
(6) Subtracted eEBL and its Uncertainty: the last component in Equation (5) is the eEBL, i.e., the fraction of the IGL extrapolated in Section 4 that comes from discrete objects that remain undetected in the NIRCam images for AB ≳ 28.5 mag. This fraction is only 2.5% of the total IGL, which itself has an uncertainty of ∼10% (Appendix B.3). Hence, the eEBL uncertainty is a very small part of the total error budget, and is not listed in Tables 4–6.
(7) Resulting Error Budget for the NIRCam sky-SB Model: in conclusion, in our error budget of the diffuse light, the uncertainty in the JWST SL model prediction is the largest uncertainty. Under the assumption that the uncertainties in modeling the L2 Zodiacal Light, the JWST Stray Light, and the Diffuse Galactic Light are independent, we add them in quadrature in Tables 4–6. The combined uncertainties in the modeled NIRCam sky-SB values are listed on the line below each component of the predicted JWST sky-SB (Total-Predict-skySB), and are typically ∼10%.
With the summaries of Appendices B–C we have all the tools to make estimates of the object-free NIRCam sky-SB and compare these to the currently available models. This is discussed in Section 5, Tables 4–6, and Figure 13.
Footnotes
- 52
- 53
E.g., https://webb.nasa.gov.
- 54
- 55
- 56
Defined as AB-mag = –2.5 log(Fν ) + 8.90, where the flux density Fν is in Jy units.
- 57
All JWST pixel values are in units of MJy sr−1, which can be converted to units of nW m−2 sr−1 by multiplying by 10−11(c/λc ), where λc is the filter pivot wavelength in microns (e.g., Equation (A15) of Bessell & Murphy 2012).
- 58
- 59
Data came from G. Brammer's website https://erda.ku.dk/vgrid/Gabriel_Brammer/JWST-Cycle1/full_timeline.html.
- 60
Note all JWST NIR filter and grism names are numbered in units of 10 nm, i.e., GR150C or F200W indicate an effective wavelength of 1.5 or 2.0 μm, respectively.
- 61
Information about when PEARLS observations have been, or will be, carried out is available on https://www.stsci.edu/cgi-bin/get-visit-status?id=1176&markupFormat=html&observatory=JWST for most PEARLS targets, and on https://www.stsci.edu/cgi-bin/get-visit-status?id=2738&markupFormat=html&observatory=JWST for the JWIDF and TDF.
- 62
For the APT tool, see https://www.stsci.edu/scientific-community/software/astronomers-proposal-tool-apt.
- 63
- 64
- 65
- 66
- 67
- 68
- 69
- 70
- 71
- 72
- 73
- 74
- 75
- 76
- 77
- 78
- 79
- 80
- 81
- 82
The NIRCam F115W filter is compared to VISTA J, because the F115W filter is closer to J band than the Y-band or VISTA 1.022 μm, which would have ΔAB = + 0.091 mag.
- 83
This estimate uses the detector gains (Section 3.1) and PHOTMJSR and PIXAR_SR keywords in the FITS headers.
- 84
- 85
- 86
- 87
https://www.cosmos.esa.int/web/spice/operational-kernels-data using the kernel jwst_horizons_20211225_20240221_v01.bsp. This JWST ephemeris may need to be corrected from time to time due to JWST station-keeping burns that happen every few weeks.
- 88