


Abstract
We present a high-resolution observation of the distant comet C/2014 UN271 (Bernardinelli–Bernstein) using the Hubble Space Telescope on 2022 January 8. The signal of the nucleus was successfully isolated by means of a nucleus extraction technique, with an apparent V-band magnitude measured to be 21.65 ± 0.11, corresponding to an absolute magnitude of 8.63 ± 0.11. The product of the visual geometric albedo with the effective radius squared is  km2. If the ALMA observation by Lellouch et al. refers to a bare nucleus, we derived a visual geometric albedo of 0.033 ± 0.009. If dust contamination of the ALMA signal is present at the maximum allowed level (24%), we found an albedo of 0.044 ± 0.012 for the nucleus having an effective diameter of 119 ± 15 km. In either case, we confirm that C/2014 UN271 is the largest long-period comet ever detected. Judging from the measured surface brightness profile of the coma, whose logarithmic gradient varies azimuthally between ∼1.0 and 1.7 as a consequence of solar radiation pressure, the mass production is consistent with steady-state production but not with impulsive ejection, as would be produced by an outburst. Using aperture photometry, we estimated an enormous (albeit uncertain) mass-loss rate of ∼103 kg s−1 at a heliocentric distance of ∼20 au.
Export citation and abstract BibTeX RIS

Original content from this work may be used under the terms of the Creative Commons Attribution 4.0 licence. Any further distribution of this work must maintain attribution to the author(s) and the title of the work, journal citation and DOI.
1. Introduction
Long-period comets are considered to be compositionally some of the most pristine leftovers from the early solar system. For most of their lifetime, they have been stored in the low-temperature environment of the Oort cloud, at the edge of the solar system (Oort 1950). Recent years witnessed identifications of several long-period comets active at ultralarge heliocentric distances (rH ≳ 20 au), implying that the long-period comets may be more thermally processed than previously thought (Jewitt et al. 2017, 2021; Meech et al. 2017; Hui et al. 2018, 2019; Bernardinelli et al. 2021). Unlike most comets that are only active within the orbit of Jupiter (rH ≲ 5 au), driven by sublimation of water ice (e.g., Whipple 1950), the cause of activity in distant comets remains unclear. Possible explanations for trans-Jovian activity include sublimation of supervolatiles such as CO and CO2 (e.g., Womack et al. 2017), crystallization of amorphous ice (e.g., 1P/Halley; Prialnik & Bar-Nun 1992), and thermal memory from earlier perihelion passage (e.g., Comet Hale–Bopp; Szabó et al. 2008). Before we can use distantly active comets to directly investigate the formation conditions of the early solar system, it is of great scientific importance to understand how their activity unfolds at great heliocentric distances.
The recent discovery of C/2014 UN271 (Bernardinelli–Bernstein) offers us another excellent opportunity to study a comet far from the Sun. This long-period comet was found in Dark Energy Survey (DES) data at a remarkable inbound heliocentric distance of rH ≈ 29 au, with additional prediscovery observations from >30 au from the Sun and exhibiting an obvious cometary feature at rH ≳ 20 au (Bernardinelli et al. 2021; Farnham et al. 2021; Kokotanekova et al. 2021). According to the orbital solution by JPL Horizons, the current barycentric orbit of C/2014 UN271 is highly elliptical (eccentricity e = 0.9993), with a high perihelion distance of q = 10.9 au and a semimajor axis of  au. The size and the albedo of the cometary nucleus are often the most important physical parameters among many others. Recently, Lellouch et al. (2022) reported that the nucleus of the comet, 137 ± 17 km in diameter, is the largest among all known long-period comets and has a visual geometric albedo of pV
= 0.049 ± 0.011. In this paper, we present our independent study of the nucleus size and albedo of the comet based on an observation at a heliocentric distance of ∼20 au, detailed in Section 2. We present our analysis in Section 3 and discussion in Section 4.
au. The size and the albedo of the cometary nucleus are often the most important physical parameters among many others. Recently, Lellouch et al. (2022) reported that the nucleus of the comet, 137 ± 17 km in diameter, is the largest among all known long-period comets and has a visual geometric albedo of pV
= 0.049 ± 0.011. In this paper, we present our independent study of the nucleus size and albedo of the comet based on an observation at a heliocentric distance of ∼20 au, detailed in Section 2. We present our analysis in Section 3 and discussion in Section 4.
2. Observation
We secured five consecutive images, each of 285 s duration, in one visit of the comet under General Observer program 16886 using the 2.4 m Hubble Space Telescope (HST) and the UVIS channel of the Wide-Field Camera 3 (WFC3) on 2022 January 8. In order to achieve the maximum sensitivity of the facility, we exploited the F350LP filter, which has a peak system throughput of 29%, an effective wavelength of 585 nm, and an FWHM of 476 nm. For efficiency, we read out only the UVIS2-2K2C-SUB aperture, the 2047 × 2050 full quadrant subarray on the UVIS channel with an image scale of 0 04 pixel−1 covering a field of view of 81'' × 81'' across. The telescope followed the nonsidereal motion of the comet, resulting in trailed background sources, despite the great distance of the comet. Image dithering was performed once between the third and fourth exposures so as to mitigate potential impacts from CCD artifacts. The observing geometry of the comet is summarized in Table 1.
Table 1. Observing Geometry of Comet C/2014 UN271 (Bernardinelli–Bernstein)
| Date and Time (UT) a | Filter |
 (s)
b (s)
b
| rH (au) c | Δ (au) d | α (°) e | ε (°) f | θ−⊙ (°) g | θ−v (°) h | ψ (°) i |
|---|---|---|---|---|---|---|---|---|---|
| 2022 Jan 08 09:24–09:56 | F350LP | 285 | 19.446 | 19.612 | 2.8 | 78.8 | 66.5 | 334.3 | 2.8 |
Notes.
a Mid-exposure epoch. b Individual exposure time. c Heliocentric distance. d Comet–HST distance. e Phase angle (Sun–comet–HST). f Solar elongation (Sun–HST–comet). g Position angle of the projected antisolar direction. h Position angle of the projected negative heliocentric velocity of the comet. i Orbital plane angle (between HST and the orbital plane of the comet).Download table as: ASCIITypeset image
In the HST images, the comet possesses a well-defined optocenter inside its bright quasicircular coma of ∼4'' in diameter, with a broad tail of ≳15'' in length directed approximately northeastwards (Figure 1).
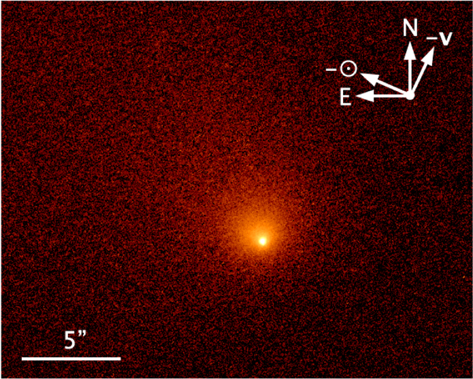
Figure 1. HST/WFC3 F350LP image of comet C/2014 UN271 (Bernardinelli–Bernstein) median combined from the five individual exposures taken on 2022 January 8. The displayed image is scaled logarithmically and is oriented such that the J2000 equatorial north is up and east is left. Also marked are the directions of the projected antisolar vector (−⊙) and the projected negative heliocentric velocity of the comet (− v ). A scale bar of 5'' in length is shown.
Download figure:
Standard image High-resolution image3. Analysis
In this section, we present our photometry to constrain the nucleus of comet C/2014 UN271 based on our HST observation. Before carrying out any photometric analysis, we removed cosmic-ray hits and hot pixels with the Laplacian cosmic-ray rejection algorithm L.A. Cosmic by van Dokkum (2001) in IRAF (Tody 1986), which successfully rendered us with much cleaner images of the comet while its signal was left untouched. We determined the image zero-point and the associated uncertainty in the V band using solar analogues with the WFC3 UVIS Imaging Exposure Time Calculator, 5 which fully covered the color range of long-period comets and their nuclei (Jewitt 2015, and citations therein).
3.1. Direct Photometry
The presence of the bright coma (Figure 1) presents an obstacle to the direct measurement of the signal from the nucleus. We used three methods of increasing power to isolate the nucleus signal.
The first method we applied was to place a circular aperture of 020 (5 pixels) in radius at the centroid of the comet in each of the five individual exposures, regard the measured signal as being all from the nucleus, and determine the sky background using a concentric annulus having inner and outer radii of 8'' and 40'', respectively. At this distance, contamination by the coma is completely negligible. We thereby obtained the apparent V-band magnitude of the region enclosed by the 020 radius aperture to be mV
= 21.11 ± 0.03, in which the reported uncertainty is the standard deviation on the repeated measurements. Because the measured signal has contributions from both the nucleus and the surrounding coma enclosed by the aperture, the true apparent magnitude of the nucleus must be fainter than the measured one. To correct for the observing geometry, we simply assumed a linear phase function with a slope of βα
= 0.04 ± 0.02 mag deg−1 appropriate for comets at small phase angles α ≳ 5° (e.g., Lamy et al. 2004). Some solar system bodies show a backscattering opposition surge caused by multiple scattering in the regolith. However, cometary nuclei in general are dark, and multiple scattering effects are likely negligible (e.g., Li et al. 2013; Masoumzadeh et al. 2017). For these reasons, we do not attempt to account for the opposition surge.
We computed the absolute magnitude of the nucleus from

where the subscript "n" denotes parameters for the nucleus, rH and Δ are, respectively, the heliocentric and cometocentric distances expressed in astronomical units (au), and α is the phase angle in degrees. Substituting, we found that the nucleus of the comet must have Hn,V > 8.09 ± 0.03, in which the uncertainty is the standard error on the mean. The geometric albedo and the radius of the nucleus are directly related to the absolute magnitude by

where pV
is the geometric albedo in the V band, Rn is the nucleus radius, and m⊙,V
= −26.76 ± 0.03 is the apparent V-band magnitude of the Sun at heliocentric distance r⊕ = 1 au (Willmer 2018). Inserting numbers, we found 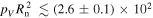 km2. Lellouch et al. (2022) recently reported pV
= 0.049 ± 0.011 and Rn = 69 ± 9 km using their ALMA observation in combination with the optical measurements by Bernardinelli et al. (2021). Their model assumes that (1) the geometric albedo of the nucleus is low, (2) the ALMA signal is uncontaminated by dust grains, and (3) the near-Earth asteroid thermal model is applicable. If their assumption that the coma contamination was negligible in the ALMA data is valid (but see Section 4.1), the reported size of the nucleus will be trustworthy because the thermal emission measures
km2. Lellouch et al. (2022) recently reported pV
= 0.049 ± 0.011 and Rn = 69 ± 9 km using their ALMA observation in combination with the optical measurements by Bernardinelli et al. (2021). Their model assumes that (1) the geometric albedo of the nucleus is low, (2) the ALMA signal is uncontaminated by dust grains, and (3) the near-Earth asteroid thermal model is applicable. If their assumption that the coma contamination was negligible in the ALMA data is valid (but see Section 4.1), the reported size of the nucleus will be trustworthy because the thermal emission measures  and almost has no dependency upon the albedo. Therefore, assuming the aspect angles are not too different between the ALMA and HST observations, we found an upper limit to the geometric albedo of the nucleus of pV
< 0.055 ± 0.014, contingent on the nucleus size derived by Lellouch et al. (2022).
and almost has no dependency upon the albedo. Therefore, assuming the aspect angles are not too different between the ALMA and HST observations, we found an upper limit to the geometric albedo of the nucleus of pV
< 0.055 ± 0.014, contingent on the nucleus size derived by Lellouch et al. (2022).
The above method provides only a coarse upper limit to  . As a second method, we again applied the same circular aperture of 020 radius at the centroid of the comet but instead measured the background in a contiguous annular region extending up to 028 from the centroid. The resulting flux measured by the aperture is still an upper limit to the counterpart from the nucleus. This is because this method underestimates the surface brightness of the coma in the central aperture, but it nevertheless provides a better constraint than does the first method, in which no correction was attempted whatsoever. We found the resulting apparent V-band magnitude to be mV
= 21.23 ± 0.03, corresponding to Hn,V
> 8.21 ± 0.03, and pV
< 0.049 ± 0.012 if still assuming the nucleus size reported by Lellouch et al. (2022). In comparison, Lellouch et al. (2022) reported the exact geometric albedo of the comet, rather than an upper limit, to be pV
= 0.049 ± 0.011, which is indistinguishable from what we obtained from the second method. We refrain from the relevant discussion until Section 4.
. As a second method, we again applied the same circular aperture of 020 radius at the centroid of the comet but instead measured the background in a contiguous annular region extending up to 028 from the centroid. The resulting flux measured by the aperture is still an upper limit to the counterpart from the nucleus. This is because this method underestimates the surface brightness of the coma in the central aperture, but it nevertheless provides a better constraint than does the first method, in which no correction was attempted whatsoever. We found the resulting apparent V-band magnitude to be mV
= 21.23 ± 0.03, corresponding to Hn,V
> 8.21 ± 0.03, and pV
< 0.049 ± 0.012 if still assuming the nucleus size reported by Lellouch et al. (2022). In comparison, Lellouch et al. (2022) reported the exact geometric albedo of the comet, rather than an upper limit, to be pV
= 0.049 ± 0.011, which is indistinguishable from what we obtained from the second method. We refrain from the relevant discussion until Section 4.
3.2. Nucleus Extraction
Given the ultrastable point-spread function (PSF) and the supreme spatial resolution and sensitivity of the HST/WFC3 camera, we opted to employ nucleus extraction as a third technique. The latter has been successfully applied to a number of comets observed by HST (e.g., Lamy et al. 1998a, 1998b, 2009, 2011) and systematically evaluated (Hui & Li 2018). The basic idea of the technique is to remove the contamination of the coma by means of fitting its surface brightness profile and extrapolating inwards to the near-nucleus region, assuming that the coma is optically thin, such that the signal from the coma and that from the nucleus are separable. The surface brightness of the coma was fitted by an azimuthally dependent power-law model. We expressed the surface brightness of the comet as a function of the angular distance to the nucleus (ρ) and the azimuthal angle (θ) in the sky plane as
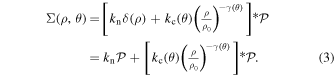
Here, kn and kc are the scaling factors for the nucleus and coma, respectively, δ is the Dirac delta function, γ is the logarithmic surface brightness gradient of the coma,  is the energy-normalized PSF, ρ0 = 1 pixel is a normalization factor to guarantee that the two scaling factors share the same unit, and the symbol * is the convolution operator.
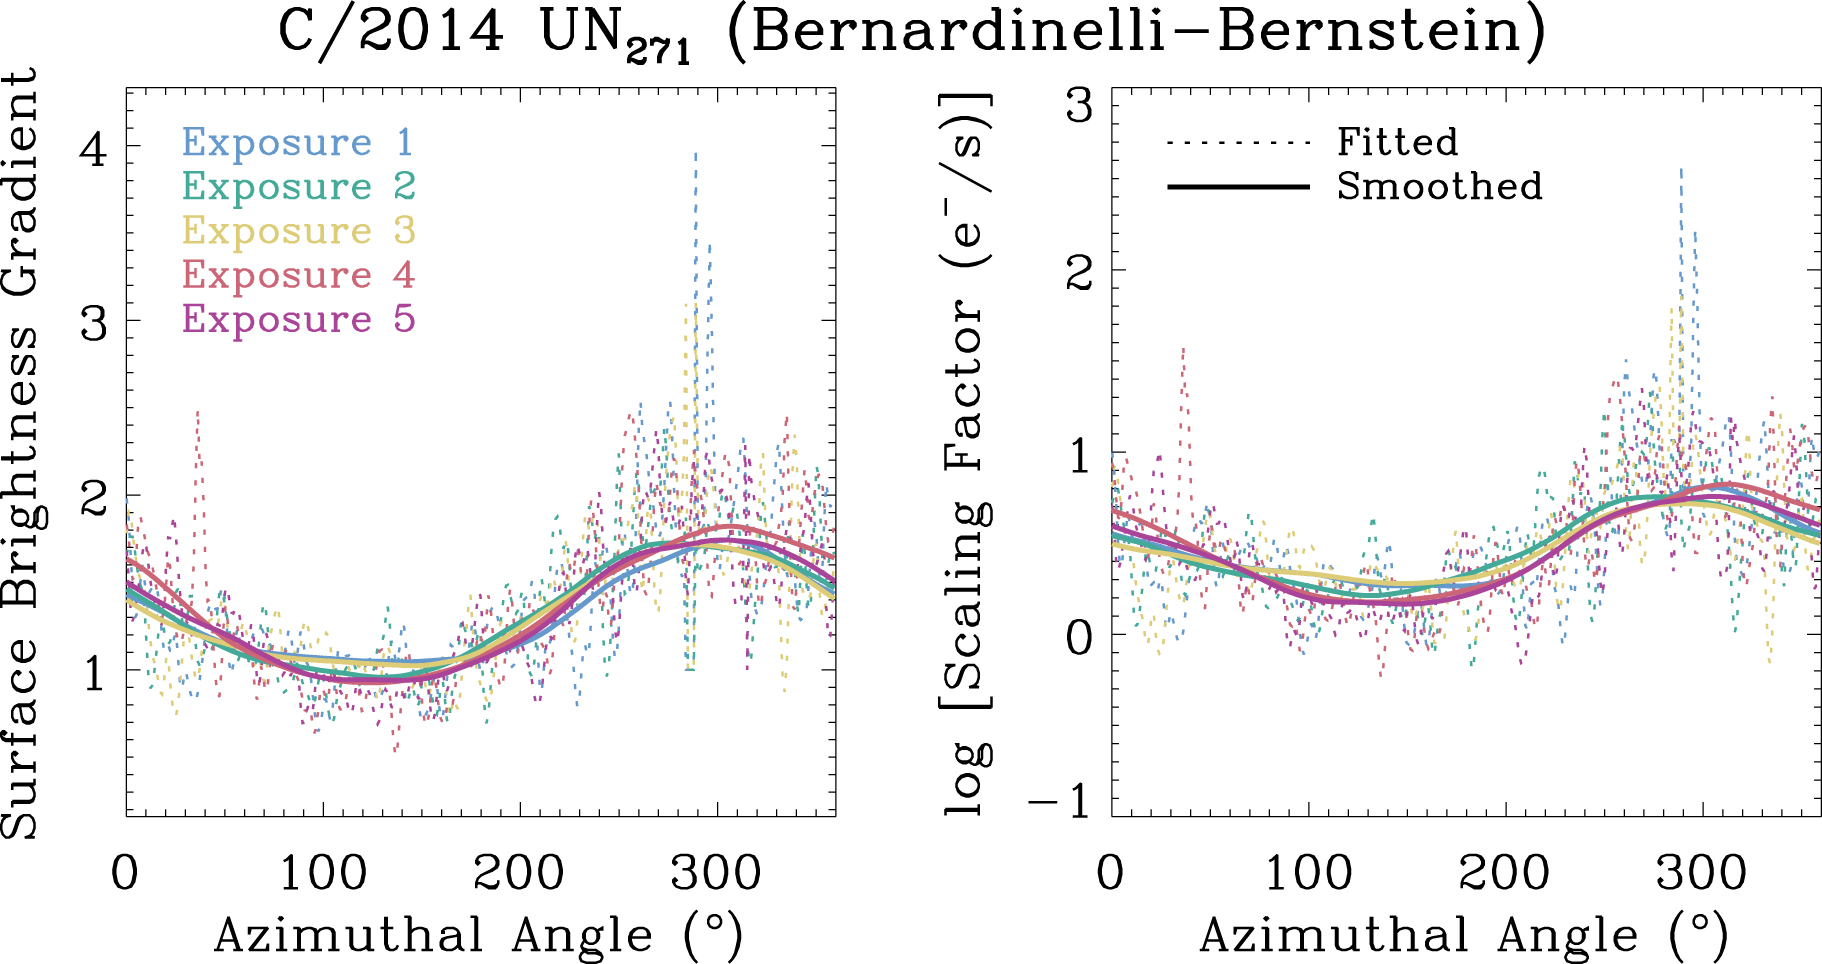
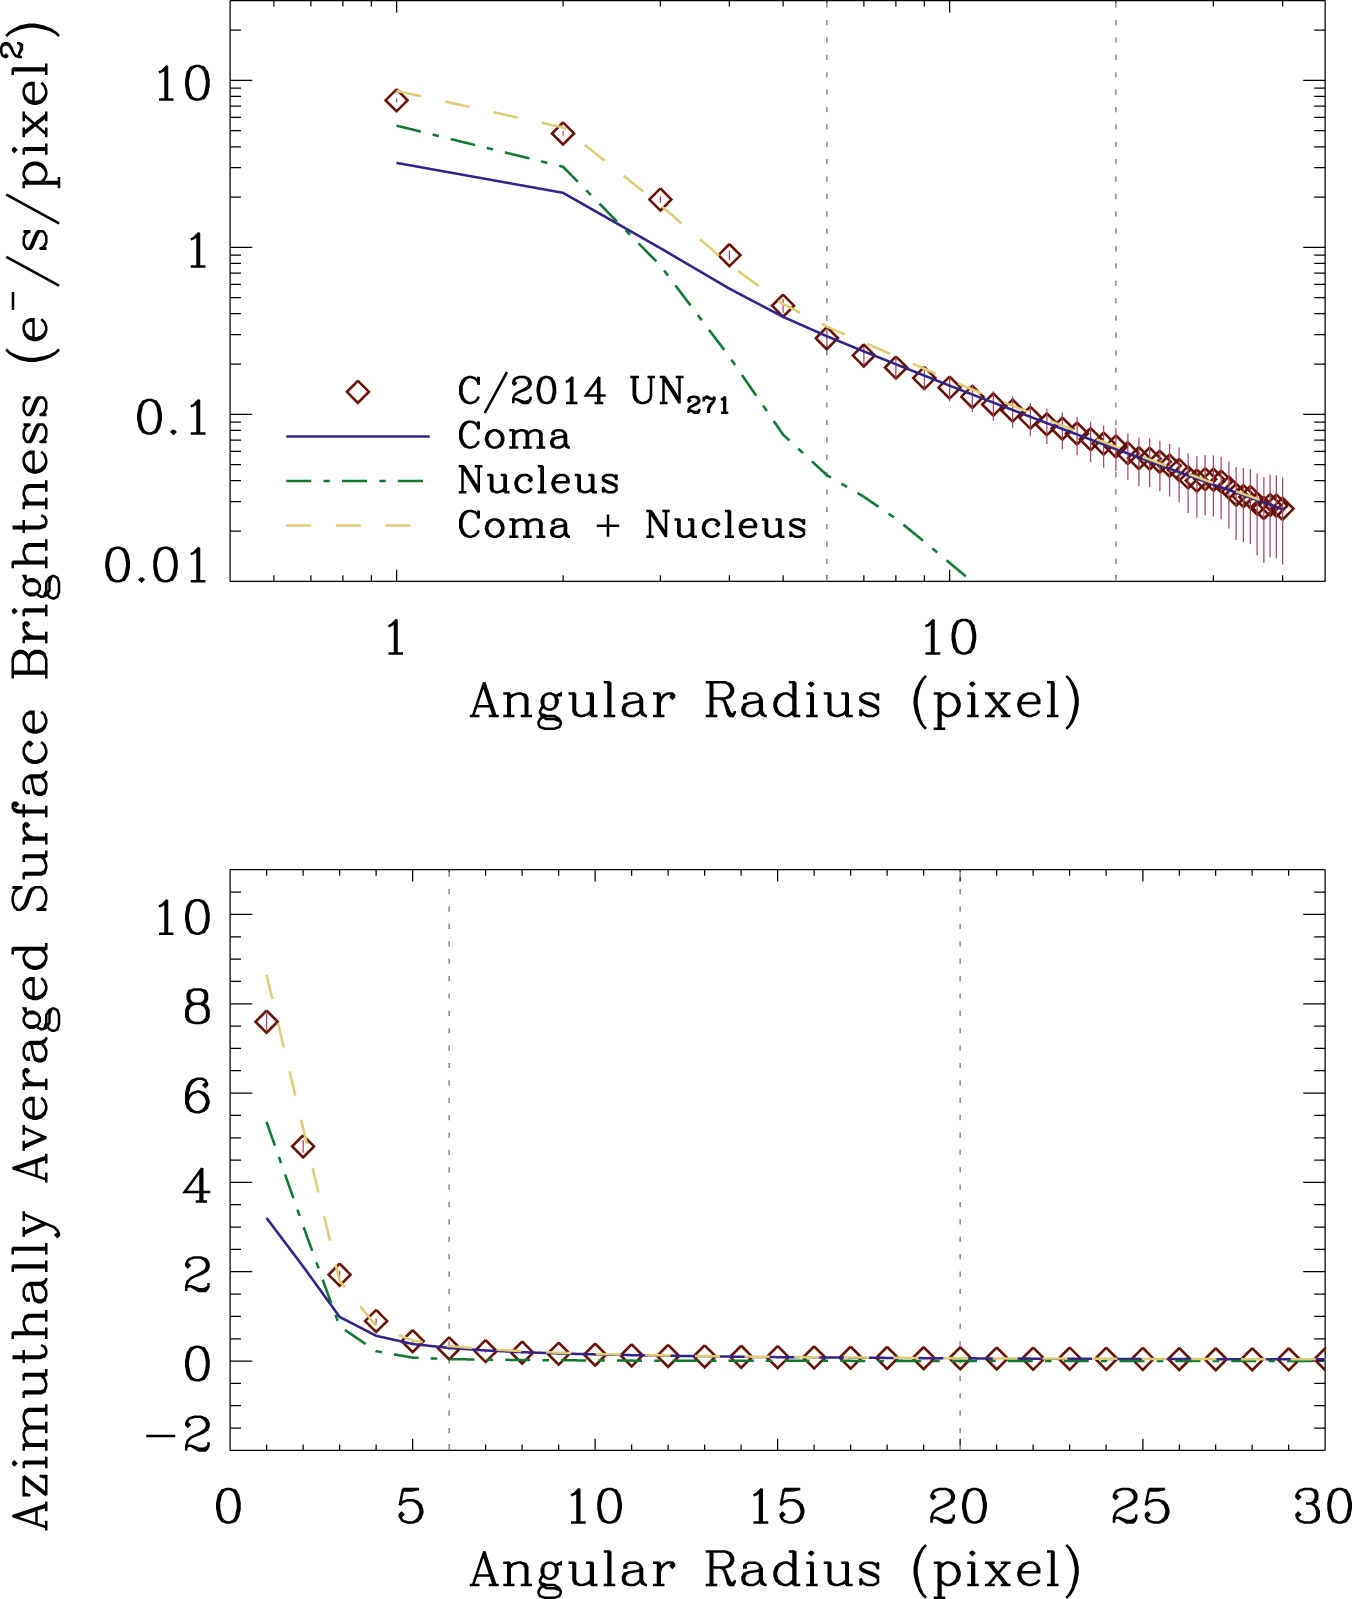
We followed the procedures detailed in Hui & Li (2018) to extract the nucleus signal from our HST data. Basically, we fitted the surface brightness profile of the coma in azimuthal segments of 1° over an annular region between 024 to 080 from the optocenter, where the contribution from the nucleus is negligible in the individual exposures. Smoothing of the best-fit parameters for the coma was carried out to alleviate fluctuations due to uncleaned artifacts caused by cosmic-ray hits (Figure 2), followed by extrapolating the surface brightness profile inwards to the near-nucleus region and convolution with the HST/WFC3 PSF model generated by TinyTim (Krist et al. 2011). Subtraction of the coma model from the observed image on a 7× resampled pixel grid revealed a well-defined stellar source around the original centroid of the comet in the residual image, which was measured to have an FWHM of 0071 ± 0004 (or 1.8 ± 0.1 pixels), in line with the FWHM of the PSF model by TinyTim, and therefore interpreted as the nucleus of the comet (Figure 3). We then fitted the PSF model to the source, whereby we obtained the scaling factor kn as the total flux for the nucleus using aperture photometry. Comparisons between the radial brightness profiles of the observation and the models are plotted in Figure 4.

Figure 2. Best-fitted (dotted lines) and smoothed (solid lines) logarithmic surface brightness gradient and the scaling factor of the coma both as functions of the azimuthal angle (0° corresponding to J2000 equatorial north, measured counterclockwise). Results from different individual exposures are distinguished by colors, as indicated in the legend in the left panel. The surface brightness profile of the comet in annular regions between 024 and 080 from the optocenter in the individual exposures was used for the best fits.
Download figure:
Standard image High-resolution image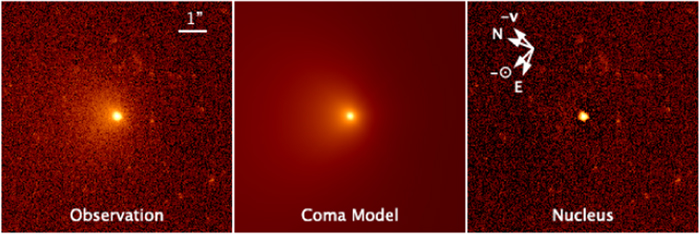
Figure 3. Brief illustration of how the nucleus extraction technique was applied for the second HST/WFC3 exposure as an example. The coma model (middle panel) was obtained by means of fitting the surface brightness profile of the observed image (left panel), followed by subtracting the former from the latter, unveiling a stellar source at the original centroid of the comet in the residual image (right panel), which we interpreted as the nucleus of comet C/2014 UN271. A 1'' scale bar and the cardinal directions, along with the directions of the projected antisolar vector and the projected negative heliocentric velocity of the comet, are marked.
Download figure:
Standard image High-resolution image
Figure 4. Radial profile comparison between the coma (violet solid line), the nucleus (green dashed–dotted line), and the total (yellow dashed line) models, and the observation (red diamonds with error bars given) plotted on log–log (upper panel) and linear (bottom panel) scales for the third individual HST exposure as an example. Results from the other four exposures are visually similar and are therefore not displayed separately for brevity. The two gray vertical dotted lines mark the annular radius range (6–20 pixels, or 024–080) within which the surface brightness profile of the coma was fitted. Compared to the scatter in the measurements from different exposures, the deviation between the model and the observation at a radius of 1 pixel is unimportant.
Download figure:
Standard image High-resolution imageIt is known that the nucleus extraction technique produces systematic biases in the determination of the nucleus signal when the nucleus is very faint compared to the adjacent coma and that it can even fail on a few occasions (Hui & Li 2018). In order to ascertain how our result might be biased by the technique, we assessed the ratio between the nucleus flux and the total flux measured within a 060 radius circular aperture. The ratio was found to be always ≳30%, falling into a regime where the bias is totally negligible (Hui & Li 2018). Therefore, we are confident that the signal of the nucleus determined from our HST observation of comet C/2014 UN271 is robust.
The result is that our best estimate of the apparent V-band magnitude of the nucleus is mn,V
= 21.65 ± 0.11. Substitution into Equation (1) yields Hn,V
= 8.63 ± 0.11, which is clearly fainter than what Bernardinelli et al. (2021) reported based on their optical observations (Hn,V
= 8.21 ± 0.05, converted from the Sloan bands; Lellouch et al. 2022), and corresponds to 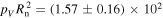 km2 yielded by Equation (2). Still adopting the nucleus size reported by Lellouch et al. (2022), we determine a nucleus geometric albedo of pV
= 0.033 ± 0.009, in which the uncertainty was properly propagated from all measured and reported errors. Our result suggests a lower albedo for the nucleus surface because it is possible that the photometry by Bernardinelli et al. (2021) is contaminated by the dust environment of comet C/2014 UN271. Nonetheless, the albedo we derived is unremarkable in comparison to those of other cometary nuclei (distributed in a narrow range of pV
≈ 0.02–0.06; Lamy et al. 2004).
km2 yielded by Equation (2). Still adopting the nucleus size reported by Lellouch et al. (2022), we determine a nucleus geometric albedo of pV
= 0.033 ± 0.009, in which the uncertainty was properly propagated from all measured and reported errors. Our result suggests a lower albedo for the nucleus surface because it is possible that the photometry by Bernardinelli et al. (2021) is contaminated by the dust environment of comet C/2014 UN271. Nonetheless, the albedo we derived is unremarkable in comparison to those of other cometary nuclei (distributed in a narrow range of pV
≈ 0.02–0.06; Lamy et al. 2004).
4. Discussion
4.1. Nucleus Size
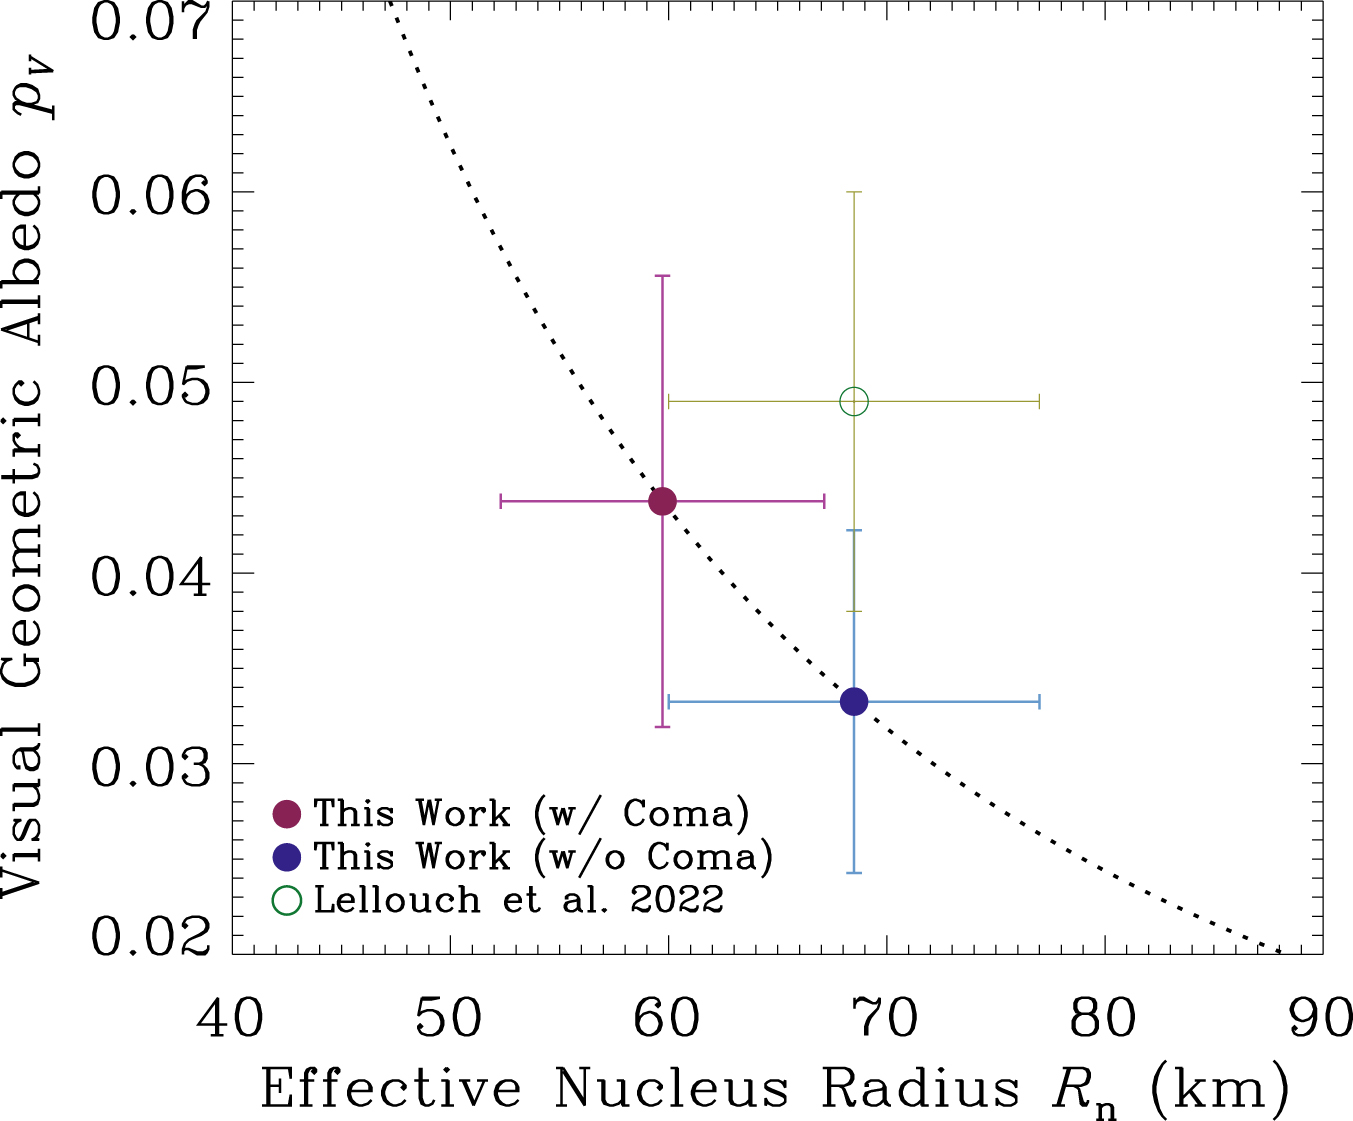
Our analysis of the HST observation of comet C/2014 UN271 provided us with an estimate of its nucleus absolute magnitude ∼0.4 mag fainter than the result by Bernardinelli et al. (2021), presumably as a result of coma contamination in the large aperture optical photometry used by these authors. If there is no dust contamination of the 233 GHz ALMA signal, the nucleus albedo must be lower than the one derived by Lellouch et al. (2022), as shown by the hollow green and filled blue circles in Figure 5.
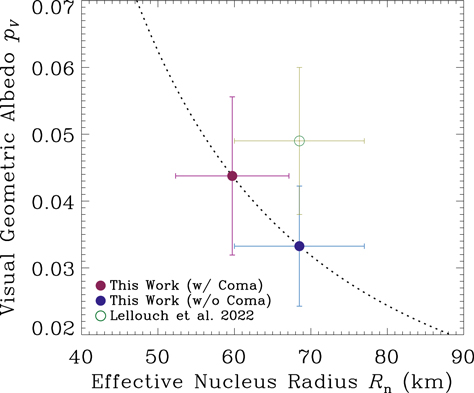
Figure 5. Geometric albedo vs. effective radius of the nucleus of comet C/2014 UN271. The dotted line shows  km2, as found from our HST photometry. Parameters of the nucleus must fall on this line. The hollow green circle marks the measurement by Lellouch et al. (2022), which relies upon the large-aperture (more likely coma-contaminated) photometry of the nucleus by Bernardinelli et al. (2021). The filled blue and purple circles show two solutions using the new
  constraint both with and without the ∼24% dust contamination of the 230 GHz thermal signal allowed by Lellouch et al. (2022).
Download figure:
Standard image High-resolution imageHowever, Lellouch et al. (2022) concluded that up to ∼24% of the 233 GHz continuum flux could be from an unseen dust coma in their data. In this case, we estimate that the effective diameter of the comet would be reduced to 119 ± 15 km and the geometric albedo increased to pV = 0.044 ± 0.012, shown as a filled purple circle in Figure 5. In order to affect the 233 GHz cross section, the dust in the comet would need to be large. Two observations suggest that the coma might indeed be rich in large grains. First, independent observations of other long-period comets (notably C/2017 K2; e.g., Jewitt et al. 2017, 2019a; Hui et al. 2018;) have convincingly revealed that submillimeter and larger dust grains are produced at great heliocentric distances. Second, based on a syndyne-synchrone computation, Farnham et al. (2021) deduced that C/2014 UN271 has been ejecting submillimeter-sized and larger dust grains for years prior to the epoch of observation. The driver of mass loss at distances ∼20 au (and potentially at much larger distances; Bouziani & Jewitt 2022) is presumably the sublimation of carbon monoxide.
An additional factor that might affect estimates of the albedo is the rotation of the nucleus, resulting in cross sections different between the ALMA and HST observations. However, most known cometary nuclei have aspect ratios ≲2:1 (e.g., Lamy et al. 2004), and so we do not expect rotational effects in nucleus photometry larger than a factor of 2.
In short, our improved estimate of the absolute magnitude shows that the nucleus of C/2014 UN271 is slightly smaller or slightly darker than that found by Lellouch et al. (2022) but we strongly confirm their result that the nucleus is larger than any other previously measured long-period cometary nucleus. Figure 5 is shown as a comparison of the results.
4.2. Mass Loss
We measured the logarithmic surface brightness gradient of the coma in Section 3.2, which allows for a qualitative diagnosis of the observed activity. In steady state, the surface brightness gradient of the coma is expected to be γ = 1 but will be steepened to ∼1.5 by the solar radiation pressure (Jewitt & Meech 1987). Indeed, we found that the surface brightness gradient of the coma lies within a range between ∼1.0 and 1.7 (see Figure 2), broadly consistent with the coma produced in steady state. The result that the gradient is generally steeper around the azimuthal angles facing toward the Sun and is shallower otherwise is expected.
In addition to characterizing the nucleus of comet C/2014 UN271, we also measured the coma using multiple concentric apertures. The background was determined in the same fashion as in the first method in Section 3.1. For correction of the observing geometry, we still assumed a linear phase function with slope βα = 0.04 ± 0.02 mag deg−1, which is also appropriate for cometary dust at small phase angles (e.g., Kolokolova et al. 2004 and citations therein). We plot the measurements in Figure 6, in which the dominant errors are systematic and due to the uncertainty in the assumed phase function. In the two smallest apertures, the measured apparent flux fluctuated marginally beyond the 1σ errors with time, possibly indicating varying cometary activity. However, we opt not to overinterpret these fluctuations.
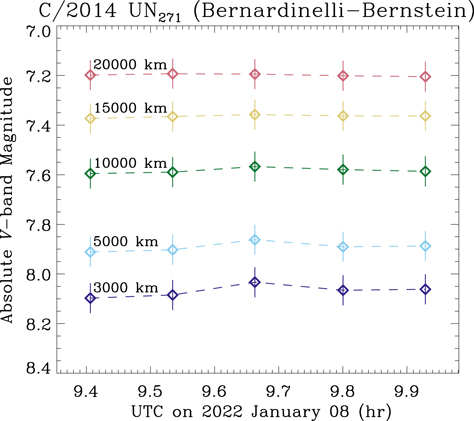
Figure 6. Absolute V-band magnitude as a function of time in UTC on 2022 January 8 for circular apertures of fixed linear radii projected at the distance of the comet, distinguished by color. The radii of the apertures are explicitly labeled on the plot. The reported errors are dominated by the uncertainty in the assumed phase function.
Download figure:
Standard image High-resolution imageIn the following, we estimate the mass loss of the comet using the largest circular aperture of a fixed projected radius of 20,000 km in the order-of-magnitude manner of Jewitt et al. (2021). Presuming that the total cross section of the dust particles having mean radius  was ejected in steady state at speeds vej ∼ 10 m s−1 (Farnham et al. 2021), we can then relate the mass-loss rate to the measured absolute magnitude of the dust by
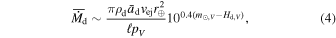
in which the subscript "d" denotes parameters of the dust grains, ρd ∼ 1 g cm−3 is the nominal bulk density of the dust grains, and ℓ = 2 × 10⁴ km is the projected radius of the largest aperture we used to measure the coma. By substitution, we find the dust mass-loss rate  kg s−1. In comparison, the distant comet C/2017 K2 (PANSTARRS) was estimated to exhibit a dust mass-loss rate of ∼102 kg s−1 at rH ≲ 20 au (Jewitt et al. 2017, 2021; Hui et al. 2018;), while Szabó et al. (2008) reported ∼103 kg s−1 for comet Hale–Bopp at similar heliocentric distances on the outbound leg of its orbit. None of the aforementioned values are better than order-of-magnitude estimates.
5. Summary
We employed the Hubble Space Telescope to observe the distant active comet C/2014 UN271 (Bernardinelli–Bernstein) on 2022 January 8. The key conclusions are:
- 1.The apparent V-band magnitude of the bare cometary nucleus was measured using high-resolution HST data and a profile-fitting technique to be 21.65 ± 0.11, corresponding to an absolute magnitude of 8.63 ± 0.11. The nucleus must satisfy
 km2, where pV
and Rn are the geometric albedo and effective nucleus radius, respectively.
km2, where pV
and Rn are the geometric albedo and effective nucleus radius, respectively. - 2.Assuming that the ALMA photometry by Lellouch et al. (2022) is free from any contamination from the dust coma, we estimated the visual geometric albedo of the nucleus to be pV = 0.033 ± 0.009. If the maximum ∼24% contamination of the ALMA flux contributed by the coma is considered, we instead derive pV = 0.044 ± 0.012 for the nucleus having an effective radius of Rn = 60 ± 7 km.
- 3.The logarithmic surface brightness gradient of the coma varies between γ ∼ 1.0 and 1.7 depending on the azimuthal angle, indicating that the dust grains are ejected in a protracted rather than impulsive manner.
- 4.From the photometric measurements of the coma, we estimated the dust mass-loss rate of the comet to be ∼103 kg s−1 at heliocentric distance rH ∼ 20 au.

We thank the anonymous reviewer for comments on the paper. This research is based on observations from program GO 16886 made with the NASA/ESA Hubble Space Telescope obtained from the Space Telescope Science Institute, which is operated by the Association of Universities for Research in Astronomy, Inc., under NASA contract NAS 5-26555. Support for this work was provided by the Science and Technology Development Fund, Macau SAR, through grants No. 0051/2021/A1 and No. SKL-LPS (MUST)-2021-2023. M.T.H. appreciates great support and encouragement from Kiwi.
Facility: HST. -
Software: IDL, IRAF (Tody 1986), L.A. Cosmic (van Dokkum 2001), TinyTim (Krist et al. 2011).