At a Glance
- Hurricane forecasts have some caveats that might not appear on a graphic.
- This includes the meaning of a storm's winds, landfall and its impacts.
- A storm's impacts can extend well beyond the forecast cone, even if it never makes landfall.
Hurricane forecasts contain a wealth of information, such as their forecast path. But there are other caveats crucial to the storm's potential impacts that may not appear on more widely used forecast graphics.
As the heart of another hurricane season is arriving, let's list some of these key subtleties you can keep in mind the next time you're monitoring another tropical storm or hurricane. Note that any graphics shown below are not from current hurricanes or tropical storms.
1. Maximum Winds Usually In A Small Area
When you see either current or forecast winds with a tropical storm or hurricane, those are technically the maximum sustained winds, according to the latest advisory from the National Hurricane Center.
In hurricanes, those maximum winds typically occur only in a small area within the ring of strongest convection encircling the eye, known as the eyewall.
However, some strong wind gusts can occur far from the eyewall, depending on how large its circulation is.

2. Winds Often Estimated From Satellite
Sometimes a system is too far away for reconnaissance aircraft to reach, and that's where satellites help out.
One way to estimate intensity from satellite data called the Dvorak technique has been in use since the 1970s. It uses the pattern of curved bands, the appearance of the eye and how deep the surrounding convection is to estimate a hurricane's wind intensity.
Meteorologists typically use a blend of satellite estimates to come up with a storm's current intensity.
Satellites can also estimate the speed and direction of winds through instruments called scatterometers. This also helps determine if a tropical disturbance has finally developed a closed circulation to become a tropical depression or storm.
3. Forecast Cone Is For The Center, Not For Most Impacts
The cone of uncertainty contains absolutely no direct information about what a storm or hurricane will produce, such as storm surge, wind, inland flooding or tornadoes.
The cone is meant to show where the center or eye of a system will likely go over the next five days. It is not meant to encompass any impacts.
Hurricanes and tropical storms are almost always wider than the cone in the days before landfall. This means that the impacts of rainfall and storm surge will expand sometimes hundreds of miles beyond the edge of the cone.
Furthermore, the size of the cone only changes once a year and is set long before hurricane season starts.
The size is set to roughly 67% of the forecast errors averaged over the previous five years.
(IN DEPTH: Cone of Uncertainty's Facts and Myths)

4. The Forecast Can Change
Forecasts of both track and intensity have become more accurate over the years. But, keep in mind that the first forecast you see of a new tropical storm may look a bit different tomorrow, or the next day.
There are a number of reasons why the forecast may change.
Perhaps the center of a weaker tropical storm reformed elsewhere, shifting the entire forecast track. New data from high-altitude aircraft missions may give computer models a better handle on the storm's steering winds.
One recent example of a significant forecast change was during Hurricane Sally in 2020, shown below. Over four days, Sally's forecast transitioned from a Louisiana to Florida Panhandle landfall.
So, be sure to check the forecast frequently for any potential, important changes.

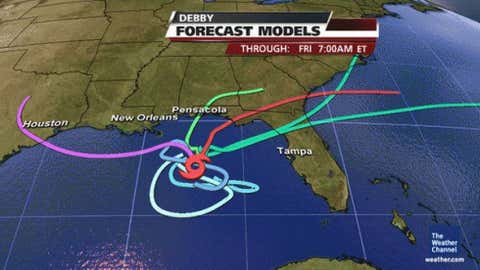
5. Forecasts Are Challenging When Storm Stalls
One of the biggest forecast challenges is when a storm's steering winds collapse, leaving it temporarily stalled.
If these steering winds remain weak, they can wreak havoc with computer models' attempts to forecast where it may go.
In addition to the aforementioned Hurricane Sally, another example of this was Tropical Storm Debby in 2012. Debby was stuck between two areas of high pressure, which lead to vastly different forecast tracks among the computer models for a while before they all came into agreement on a drift toward Florida.
So, next time you happen to notice a tropical storm or hurricane stalled out, know that forecast might be more difficult than usual and could change.
6. Landfall Is Both A Benchmark And A Process
We often say that the definition of a storm’s landfall is when the center of its eye crosses the coast, but there’s no major instantaneous change in the storm that takes place when this occurs. Storm surge, flooding and wind often persist for hours after the center crosses the coast.
The lighter colors in the central Florida Panhandle and southwest Georgia shown below are areas where high winds from Hurricane Michael knocked down trees as it came inland. While Michael's peak winds may have been near 160 mph near the coast, wind damage occurred well into Georgia.
Michael produced wind gusts over 100 mph well into southwest Georgia and hurricane-force gusts reached central Georgia. Counties as far inland as seven counties inland from the Gulf of Mexico completely lost power in Michael.
Damage never stops at the coast when a storm makes official landfall. Remember, at that landfall point, only half of the hurricane has come ashore.

7. Wind Speeds On Land Rarely Match Category At Landfall
Due to increased friction from land and the loss of power and instruments as a hurricane makes landfall, landfall intensities are often estimated from wind speeds over the water. Wind speeds are typically reduced by 15% over land.
So, for example, if a Category 3 storm makes landfall, it is very unlikely that you will experience Category 3 sustained wind speeds, even at the coast.
8. High-End NWS' Biggest Warning Reserved For Most Potent Hurricanes
An extreme wind warning is issued by the National Weather Service when the eyewall of a hurricane comes ashore and is typically reserved for wind speeds of at least 115 mph.
The warning is so exceptional that it took over a decade for its first issuance after it was developed. The warning has been issued less than 15 times.
Here's one example from Hurricane Michael:
9. Hurricanes Come In Different Sizes, And That Matters
While its wind speeds get most of the attention, a hurricane's size - how large an area its wind circulation extends - is important to determine how severe and far-reaching its impacts will be.
Large hurricanes - like Katrina and Sandy - can generate massive storm surge and coastal flooding over a large area, not to mention widespread high winds, even if their peak winds are less extreme.
Smaller hurricanes - such as Andrew and Charley - can still produce destructive winds, but over a smaller area. Their storm surge can still be life-threatening, but not as extreme or widespread as larger hurricanes.
Meteorologists will often tell you in their forecast whether a storm is large or small and if it may grow.

10. How Fast It Moves Matters More For Rainfall
One factor to monitor as a tropical storm or hurricane nears the coast and moves inland is its forward speed.
Put simply, slow-movers can produce much more rain than those that move fast.
Among many recent examples was the prolific rain from Hurricane Harvey, which took five days after landfall to finally leave Texas. Up to 60 inches of rain produced widespread flooding near the upper Texas coast.
Pay attention to the forecast path graphic for a storm. If the typical cone shape of the graphic looks more like a circle with little movement over the next five days, rainfall flooding is likely to be a serious threat.
(IN-DEPTH: Why A Hurricane's Forward Speed Matters)

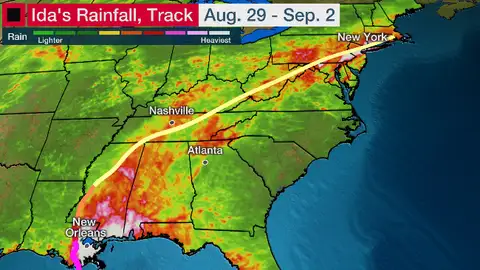
11. The Worst Damage Can Happen Well Inland
Freshwater flooding and tornadoes can spread to parts of the Midwest and Northeast as storms turn northward after coming ashore on the Gulf or East coasts. Hurricane Ida in 2021 produced both deadly flooding and tornadoes in the Northeast after making landfall in Louisiana.
In fact, Ida caused more deaths in the Northeast (54) than on the Gulf Coast (34), according to the National Hurricane Center.
Hurricane Isaias is another example of damage occurring well inland of the landfall point.
Isaias made landfall in the Carolinas in early August of 2020, then rode up the U.S. East Coast for a couple of days.
Isaias produced wind gusts as high as 78 mph on Long Island, a storm surge of 2 to 4 feet as far north as Philadelphia and tornadoes along the coast as far north as Connecticut.
At one point, nearly three million customers lost power in the Northeast. The damage toll was the most significant storm for the Northeast since Superstorm Sandy in 2012 – $3.5 billion.
12. They Can Be Deadly After A Storm Hits, Or Even If They Don't Directly Hit
Hurricanes don't need to be in your region or even make landfall near you to be deadly.
In recent years, multiple hurricanes have caused deaths due to heat, loss of electricity and storm cleanup after they passed through Louisiana.
Hurricane Laura, in 2020, killed 34 people after it left its landfall zone in Texas and Louisiana. These deaths were related to carbon monoxide poisoning, storm cleanup-related activities, electrocutions and heat stress. At least 25 deaths occurred in these categories in Louisiana and Alabama after Hurricane Ida in 2021.
You should never put your generator inside your house.
Years earlier, dozens of people died due to heat exhaustion in the evacuation before Hurricane Rita and carbon monoxide poisoning following the storm in 2005.
But storms don't even need to hit your area to be deadly.
While Hurricane Lorenzo was closer to Africa and Europe than North America in almost its entire lifecycle, it still caused the deaths of eight people in the United States.
Rough surf and rip currents killed people from Rhode Island to Florida despite being thousands of miles away.
In fact, Lorenzo holds the records for the easternmost Category 5 hurricane in the Atlantic and the longest-lasting major hurricane east of 45 degrees longitude.

The Weather Company’s primary journalistic mission is to report on breaking weather news, the environment and the importance of science to our lives. This story does not necessarily represent the position of our parent company, IBM.