
At the end of last year, we described a liquidity hole that we expected would grow and envelop most assets. Last year, the fundamental conditions for assets (particularly bonds) deteriorated quickly, but asset purchases by the Fed combined with huge purchases by banks left asset markets swamped with money. That money worked its way to every corner of asset markets, leaving the pricing of many assets dependent on the continual flow of new purchases. The Fed’s late but abrupt reaction to inflation is now rippling through financial markets and, by our measures, is about to push the US economy into a recession and a significant decline in profits. In a Bloomberg interview Thursday, co-CIO Greg Jensen discussed the implications of this liquidity pullback and the Fed reaction function for different financial assets. In this report, we give an update on the big ongoing shifts we have discussed before that are behind what we are seeing today:
- The liquidity hole is expanding rapidly at the same time as interest rates are rising, creating a double whammy for financial assets. The Fed has shifted from massive quantitative easing in response to the COVID shock to quantitative tightening at a pace twice as large as that of past episodes. The Fed’s actions are most directly creating this liquidity hole in the bond market. As we noted, not only was the Fed itself buying bonds at a rapid pace during QE, but we also saw the banks plough the reserves created in this process back into bonds. Both are now sellers, and this liquidity shortfall is reverberating across financial assets broadly and hitting the frothiest segments the most. This is occurring alongside one of the fastest paces of interest rate tightening getting priced in that we have seen in decades.
- With inflation at center stage for policy makers today, the Fed’s reaction function to weakness in risk assets and the real economy is very different. Over the last several cycles, inflation was low, and as the economy weakened and the equity market fell, the Fed eased to sow the seeds for an economic recovery and a bottom in the stock market. This time, the Fed is constrained by intolerably high inflation such that even if the economy and stock market fall, it will need to maintain tighter policy for longer. A lot of Fed tightening is now priced into the rates markets, and there is a decent chance that the Fed will need to pivot earlier, depending on how weak the economy may get. But even if the Fed were to settle at above-target inflation of, say, 3%, that would still require short rates of something like 4% and would likely imply significant further downside for equities from here. All in all, the “Fed put” is at a way lower strike price than what we are used to.
- Financial assets are reconverging with the real economy and cash flows after materially outperforming. Over the past decade, we saw financial assets disconnect from the economy, first because of falling real yields and then due to the massive money printing and fiscal stimulus in response to the COVID shock. On top of compressing yields, actual cash flows for US companies also disconnected from the economy due to fiscal transfers supporting household spending, even as corporations cut back on labor costs, allowing profit margins to explode. We have so far only reversed a small part of this outperformance.
- We are likely still in the early innings of this reversal in equities: Despite the significant market action, the S&P has barely priced in a weaker economy, with earnings expectations remaining high and essentially most of the drawdown explained by the rising discount rates. This indicates that we have a lot more weakness for equities in store as their pricing converges with the economic reality, especially if the Fed tightens close to what the interest rate markets are reflecting.
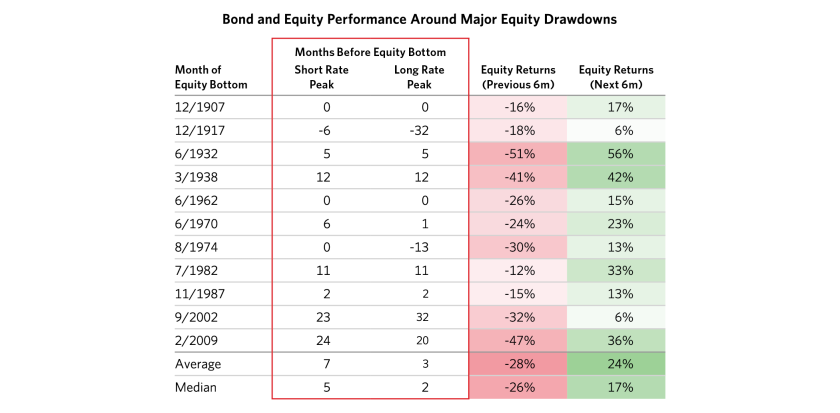
We went back and studied every major US equity bear market over the last 120 years and, in almost all cases, the bottoms either happened well into easing or at turning points in policy. The chart below highlights how the point where short rates roll over (circled) almost always precedes the equity market bottom (shaded).

The second and third columns on the table below show how many months before the equity market bottom short rates and bond yields peaked. As you can see from the positive numbers, the equity markets almost always bottomed only after the interest rates had peaked and we were already in an easing phase.
To highlight the periods we chose for our study, the next chart shows the major drawdowns for the US equity market since 1900.

We now walk through the big themes that are driving the market action this year.
Financial Assets Are Facing the Double Whammy of the Liquidity Hole Expanding Rapidly at the Same Time as Interest Rates Are Rising
As you can see below, in response to the COVID shock, the Fed both quickly cut rates to near zero and embarked on a massive QE program, which was a major support to financial assets, particularly given that the economy was still locked down. As conditions have normalized and inflation has become a bigger concern, the Fed has started to rapidly withdraw this liquidity. The Fed is priced to sharply normalize interest rates from here and will be simultaneously shrinking its balance sheet at a massive $95 billion per month pace by September (reasonably faster than the last quantitative tightening).

The liquidity hole is being created most directly in the bond market and is then reverberating across other assets. Not only was the Fed itself buying bonds at a rapid pace during QE, but we also saw the banks buy bonds at a pace never seen before. The pairing of QE with huge fiscal transfers and spending resulted in a very large amount of retail deposits landing on bank balance sheets. Given subdued private sector demand for credit, banks ploughed a record amount of these reserves into treasuries and agencies. Now, as the Fed is moving to selling bonds, banks are also turning from buyers to sellers, creating a large liquidity hole.

Given Inflation, Trade-Offs Facing the Fed Are Substantially More Complicated Today Than in the Past 40 Years
For the first time since the 1980s, inflation is a meaningful constraint for the Fed. The chart below illustrates how, in past cases, inflation was either not much of a policy constraint (e.g., the 1990s on) or meaningfully down by the time markets bottomed (i.e., 1982), or the Fed eased with a weakening economy but still high inflation (i.e., the 1970s). None of these situations seem likely today: inflation at 8% is a clear policy constraint; it has not turned over; and given this, the Fed is discounted to continue tightening.

We have already seen a major repricing in the rates markets in response to these conditions. The degree of discounted tightening today is about as large as any period in the last 50 years and will be a big deal for the economy if the Fed follows through.

The Liquidity Hole Is Reverberating Across Financial Assets, and the Frothiest Stuff Has Been Hit the Most So Far; However, US Equities in Aggregate Have Barely Priced In Weaker Cash Flows
The pullback in liquidity has contributed to a major correction in some of the frothiest markets, with these moves accelerating in the last couple of days. For example, the unprofitable/emerging tech stocks, a retail favorite, have already fallen 50% off their 2021 peaks. Similarly, cryptocurrencies are in a steep drawdown. While deflating bubbles has not been a focus for the Fed, it is likely a welcome development.

US equities are now down over 20% this year but are not pricing in the degree of real economic weakness we think is likely. The left chart below illustrates how, adjusted for discount rate changes, US equity returns would be close to flat this year. The chart on the right shows the priced-in EPS growth for US equities, which remains quite strong.

The Reconvergence of Financial Assets and the Real Economy and Cash Flows Is Still in the Early Innings
Since the financial crisis, financial asset returns have meaningfully outpaced nominal growth. In the 2010s, this was in large part because secularly low real yields supported asset valuations, fostering strong performance for both bonds and the liquidity-sensitive equities that played an increasingly large role in the US equity market. This divergence widened with government stimulus during the COVID shock: unique MP3 dynamics supported higher equity multiples as fiscal support elevated household savings, which in turn were increasingly channeled back into equity markets as retail participation surged.


On top of this, the MP3 dynamics also allowed corporate profits to disconnect from the overall economy. Fiscal transfers to households more than offset the loss in private incomes during the shock, allowing households to maintain their spending power. A result of this was that US corporations were able to collect higher revenues from the household sector without paying correspondingly higher wages—again, only because these workers were subsidized by government stimulus transfers (borrowing that was monetized by quantitative easing). This caused profit margins to balloon and elevated corporate cash flows. As this stimulus wears off and fiscal spending pulls back, there is significant pressure for corporates’ profit share to normalize in an environment where private sector wages are rising.

This research paper is prepared by and is the property of Bridgewater Associates, LP and is circulated for informational and educational purposes only. There is no consideration given to the specific investment needs, objectives or tolerances of any of the recipients. Additionally, Bridgewater's actual investment positions may, and often will, vary from its conclusions discussed herein based on any number of factors, such as client investment restrictions, portfolio rebalancing and transactions costs, among others. Recipients should consult their own advisors, including tax advisors, before making any investment decision. This report is not an offer to sell or the solicitation of an offer to buy the securities or other instruments mentioned.
Bridgewater research utilizes data and information from public, private and internal sources, including data from actual Bridgewater trades. Sources include, Arabesque ESG Book, Bloomberg Finance L.P., Bond Radar, Candeal, Capital Economics, CBRE, Inc., CEIC Data Company Ltd., Clarus Financial Technology, Conference Board of Canada, Consensus Economics Inc., Corelogic, Inc., Cornerstone Macro, Dealogic, DTCC Data Repository, Ecoanalitica, Empirical Research Partners, Entis (Axioma Qontigo), EPFR Global, Eurasia Group, Evercore ISI, Factset Research Systems, The Financial Times Limited, FINRA, GaveKal Research Ltd., Global Financial Data, Inc., Harvard Business Review, Haver Analytics, Inc., Institutional Shareholder Services (ISS), The Investment Funds Institute of Canada, ICE Data, ICE Derived Data (UK), Investment Company Institute, International Institute of Finance, JP Morgan, MarketAxess, Medley Global Advisors, Metals Focus Ltd, Moody’s ESG Solutions, MSCI, Inc., National Bureau of Economic Research, OAG Aviation, Organisation for Economic Cooperation and Development, Pensions & Investments Research Center, Refinitiv, Rhodium Group, RP Data, Rystad Energy, S&P Global Market Intelligence, Sentix Gmbh, Shanghai Wind Information, Sustainalytics, Swaps Monitor, Totem Macro, Tradeweb, United Nations, US Department of Commerce, Verisk Maplecroft, Visible Alpha, Wells Bay, Wind Financial Information LLC, Wood Mackenzie Limited, World Bureau of Metal Statistics, World Economic Forum, YieldBook. While we consider information from external sources to be reliable, we do not assume responsibility for its accuracy.
The views expressed herein are solely those of Bridgewater as of the date of this report and are subject to change without notice. Bridgewater may have a significant financial interest in one or more of the positions and/or securities or derivatives discussed. Those responsible for preparing this report receive compensation based upon various factors, including, among other things, the quality of their work and firm revenues.