Bruce Betts • Jun 24, 2022
LightSail 2 getting lower as it completes third year in space
We are celebrating the third anniversary of the launch of our LightSail 2 solar sailing spacecraft.
Operating far beyond its expected lifetime, LightSail 2 is still working, providing engineering data and stunning images as it orbits the Earth. Alas, as expected, atmospheric drag is bringing the spacecraft downward toward a fiery burn-up in the Earth’s atmosphere, likely to occur in the next several months.
After a brief review including where you can find more information, this update will focus on significant happenings in the last year for LightSail 2, particularly orbital altitude evolution including successful orbit raising followed by the spacecraft getting lower and lower.

A quick mission review
Early in the mission, LightSail 2 achieved its major technical goal, becoming the first small spacecraft to demonstrate controlled solar sailing, using only sunlight reflecting off the sail as propulsion to change its orbit. We have continued to work to learn more and sail more efficiently as part of its extended mission including its second year in orbit as well as this last year, its third year, which we will focus on here.
We also have achieved LightSail 2’s other goals which we continue to improve upon. These include involving and exciting our members and the general public in space exploration, and demonstrating and raising the awareness of solar sailing as a viable potential propulsion technique within the technical community as well as outside of it. We also continue to share what we’ve learned with members and the public through all of our media channels including this week’s update on Planetary Radio, and also through technical publications and conferences. We’ve even had a quarter-scale model of LightSail 2 with a deployed sail and other LightSail 2 items on display in the Smithsonian in Washington, D.C. during this last year as part of their FUTURES exhibit.

The good, the bad, and the ugly of orbital altitude
When it comes to the last year and the spacecraft’s orbital altitude, it was the best of times, it was the worst of times. It has been a tale of two situations. (My apologies to Charles Dickens).
It was a very fruitful (northern) summer in 2021. Our solar sailing efficiency improved into early September, and we had our most successful sailing of the entire mission as measured by the change in average orbital altitude.
Throughout most of the first two years of the mission, LightSail 2 would lose a few to several tens of meters per day on average. When it was in solar sailing mode following its planned strategy during the first months of the mission, we would lose on average 19 meters per day compared to 34 meters per day when we were not in solar sailing mode. Very occasionally we would actually gain a few meters of altitude.
During the glorious summer of ‘21, we recalibrated the gyroscopes on the spacecraft to account for drift we discovered. The gyroscopes, or gyros for short, measure the spin rate around different axes. If the measurements are correct, the software on board can successfully utilize torque rods, basically electromagnets, to push against the Earth’s magnetic field to take out undesired spin.
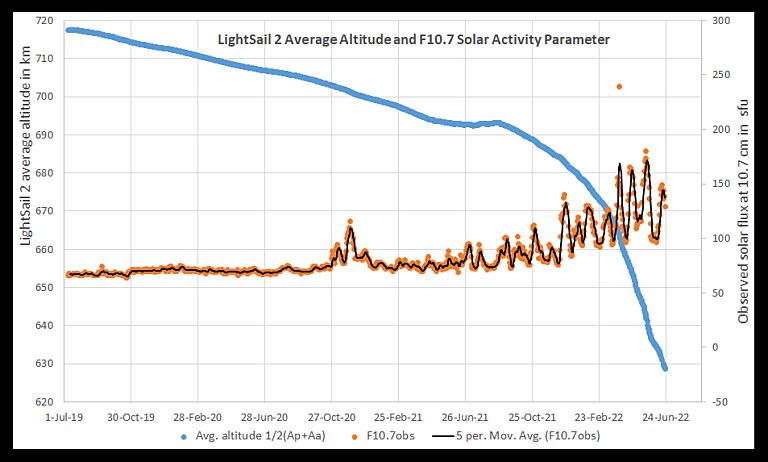
But the gyros began returning data that measured incorrect spin rates. We developed techniques to calibrate the gyros on orbit, and updated the onboard flight software to enable corrections to the gyro bias parameters. The update improved our sail control, thus improving our solar sailing. The result was many days where we actually raised the altitude by tens to even over 100 meters (about 328 feet) per day. You can see this in the plot of average altitude with time as an upward trend in the altitude line during those months.

Alas, the beautiful summer transitioned quickly to a cold, cold winter. Altitude began dropping fast and on average it has continued to drop faster and faster since then. You can see this easily in the plot of altitude versus time.
For reference, in the first year of the mission, we dropped about 10 kilometers (about 6 miles), and in the second year about 14 kilometers (about 9 miles). During its third year, despite the good summer, LightSail 2 has dropped about 67 kilometers (roughly 42 miles). As of this writing, its average altitude is about 627 kilometers (about 390 miles), down from about 718 kilometers (roughly 446 miles) at the start of the mission.
There are three main reasons for the steep drop-off in altitude in the last few months. Sailing efficiency had some effect. We had communication challenges with the spacecraft, in part due to ground station components breaking and having to be replaced. Anytime we have trouble communicating with the spacecraft we are unable to feed it information such as knowledge of its own orbit on a regular basis, causing control of the sail to be less efficient.
The second reason is atmospheric drag, which becomes a larger effect as you get lower because the atmospheric density increases very rapidly. This can be hard to imagine since we typically think of 600 to 700 kilometers (about 373 to 435 miles) above the Earth as space, emphasized by the International Space Station orbiting around 400 kilometers (roughly 250 miles). But there are still particles of atmosphere up there and when you hit them going some 30,000 kilometers per hour (nearly 20,000 miles per hour), they slow you down.
Our case is more extreme than most spacecraft because the area of our sail is very large compared to the mass of the spacecraft. This is great for solar sailing, but terrible for atmospheric drag. Imagine throwing a rock compared to throwing a piece of paper. Atmospheric drag will stop the paper much faster than the rock. In our case, LightSail 2 is the paper. As the spacecraft drops lower, the atmospheric drag gets worse and worse.
Finally, the third reason is sort of part of the second, but involves another celestial body. Increased solar activity — more solar flares —heats the Earth’s upper atmosphere causing it to expand. So, when the Sun is more active, more atmosphere expands to higher altitudes, and your spacecraft hits more particles of atmosphere at a given altitude. As you can see from the included graph, solar activity began a significant increase around the time we started dropping faster becoming a very significant factor very quickly. Most of our mission occurred during very low solar activity and when we were at the highest altitude we were going to be, thus atmospheric drag was lower and solar sailing could make more of a difference. But with the Sun revving up as it approaches solar maximum (a peak in solar activity that occurs on an approximately 11-year cycle), the atmosphere is denser at a given altitude, thus the atmospheric drag is higher.
Bottom line: we’re coming down faster and faster. The answer to the obvious question of when the spacecraft is going to reenter the atmosphere is: we don’t exactly know. Modeling we’ve done as well as even just a qualitative look at the graph indicates that it will be in the next several months.

Spacecraft operations and spacecraft health
The spacecraft is still working with no major component failures with time, an amazing testament to the many tens of people over the years who’ve worked on it and tested it on the ground and in space, as well as to the durability of the components. Data we have received show that the spacecraft is still successfully executing solar sailing mode: rotating the spacecraft twice per orbit to go from sail face-on to edge-on to sunlight.
We have had communications issues, particularly early this calendar year that limited the data coming down. Some of those had to do with issues on the ground side including hardware failures, but many of the reasons for the communications issues remain uncertain. Recently, communication has improved. All along, the spacecraft has continued to send out basic engineering telemetry “beacons” every seven seconds, which has continued to give us snippets of information about key parameters like temperatures, battery voltages, and memory availability. But gaps in two-way communication impacted how much detailed telemetry with more engineering information from recorded periods and how many pictures we could command down.

Imaging and sail condition
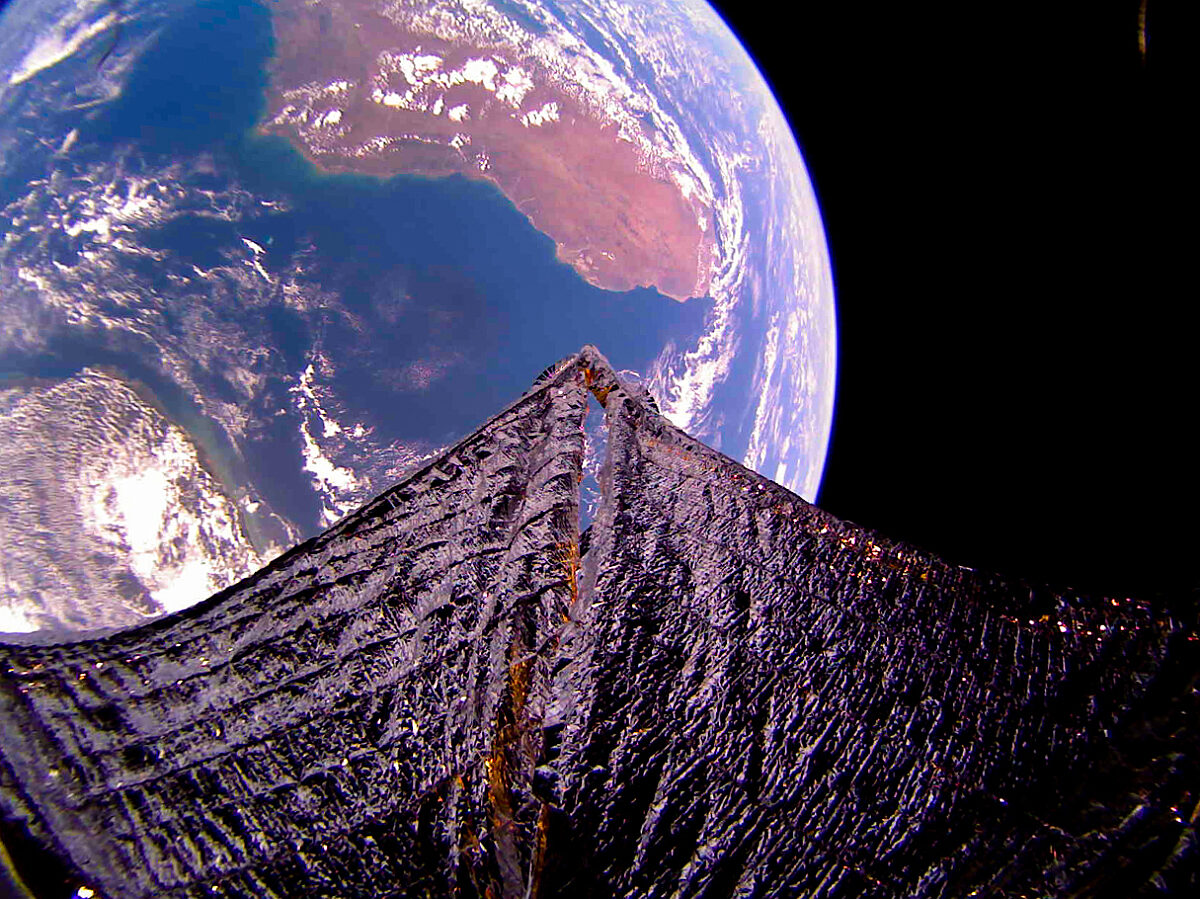
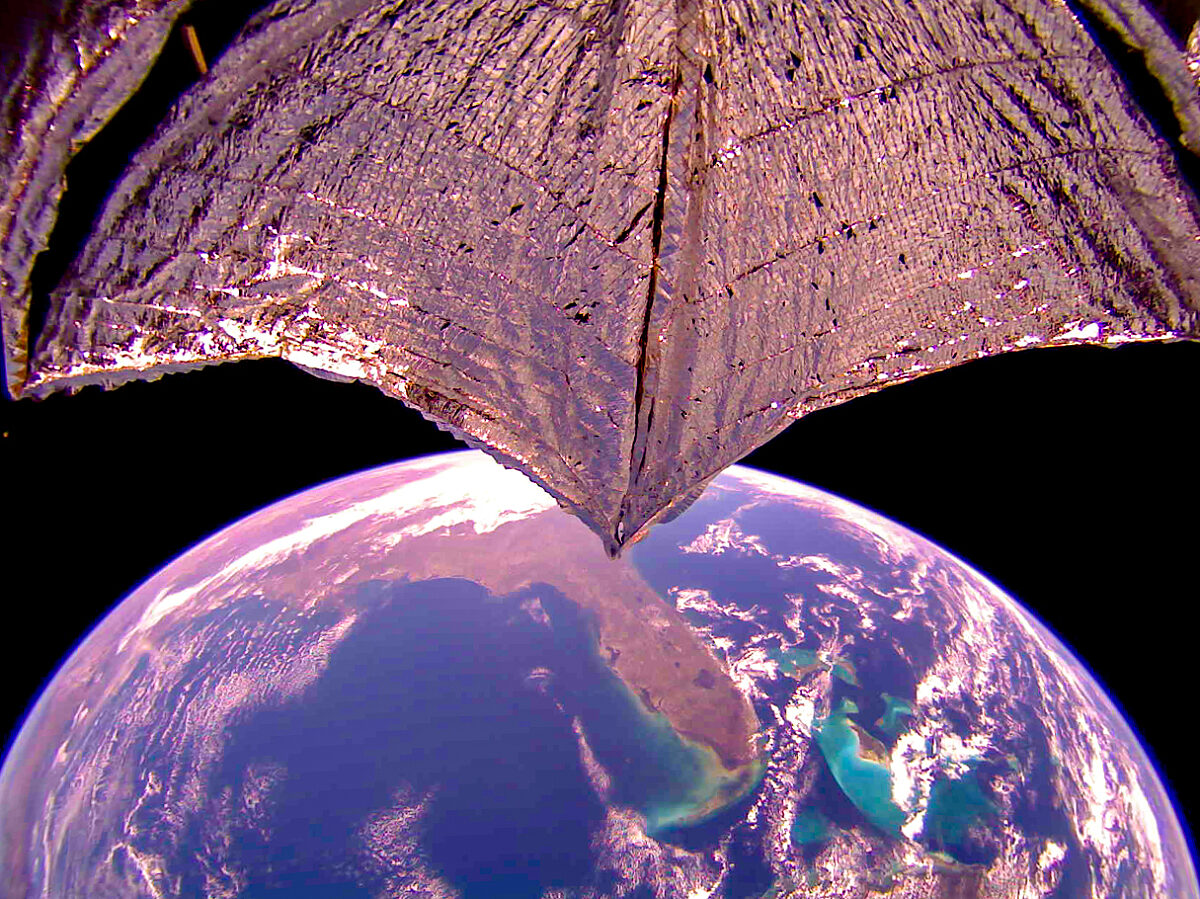
We continue to take images from the two onboard fisheye cameras. We do this in part for stunning pictures of interest to the public as well as ourselves. But we also do this for engineering purposes, to study the spacecraft and sail particularly looking for any major changes.
Amazingly, though we saw shifts in the sail and its booms as well as some degradation of the aluminized Mylar sail material in the first several months of the mission, there has been very little change over the last year.
The future
We will make the most out of the next several months before LightSail 2 finally burns up. But even after the spacecraft is gone, the mission will not be over.
The core team* will carry out final mission analyses and publication of papers and presentations at conferences. And we will continue to stay in contact with the NASA missions that we have worked with sharing information — the missions that will carry on the legacy of the LightSail program in bigger and better ways, including NEA Scout, ACS3, and Solar Cruiser, as well as other missions coming up in the future. As part of the legacy for the future, we will also archive data for future use, in addition to the publications that have been and will continue to document various aspects of the mission.
Of course, we will continue through our various media channels to keep you updated on the progress of the mission. And anytime you want, you can check the LightSail-related articles on our website, the technical publications, solar sailing-related episodes of Planetary Radio, and you can see the mission control dashboard for the latest engineering information from the spacecraft including a plot of the orbit apogee and perigee using the latest available data.
The LightSail 2 mission and the LightSail program would not have been possible without the support of our members and donors. It has been entirely funded by over 50,000 individual donors. Thanks for your support.
*The LightSail 2 Operations Core Team is: Dave Spencer (project manager, JPL/Vestigo Aerospace), John Bellardo (Cal Poly San Luis Obispo), Barbara Plante (Boreal Space), Justin Mansell (Purdue University), and Bruce Betts (program manager, The Planetary Society).
Let’s Go Beyond The Horizon
Every success in space exploration is the result of the community of space enthusiasts, like you, who believe it is important. You can help usher in the next great era of space exploration with your gift today.
Donate Today

 Explore Worlds
 Find Life
 Defend Earth

