|
|||||||||||||||||||||||||||||||||||||
|
|
 |
 |
|||||||||||||||||||||||||||||||||||
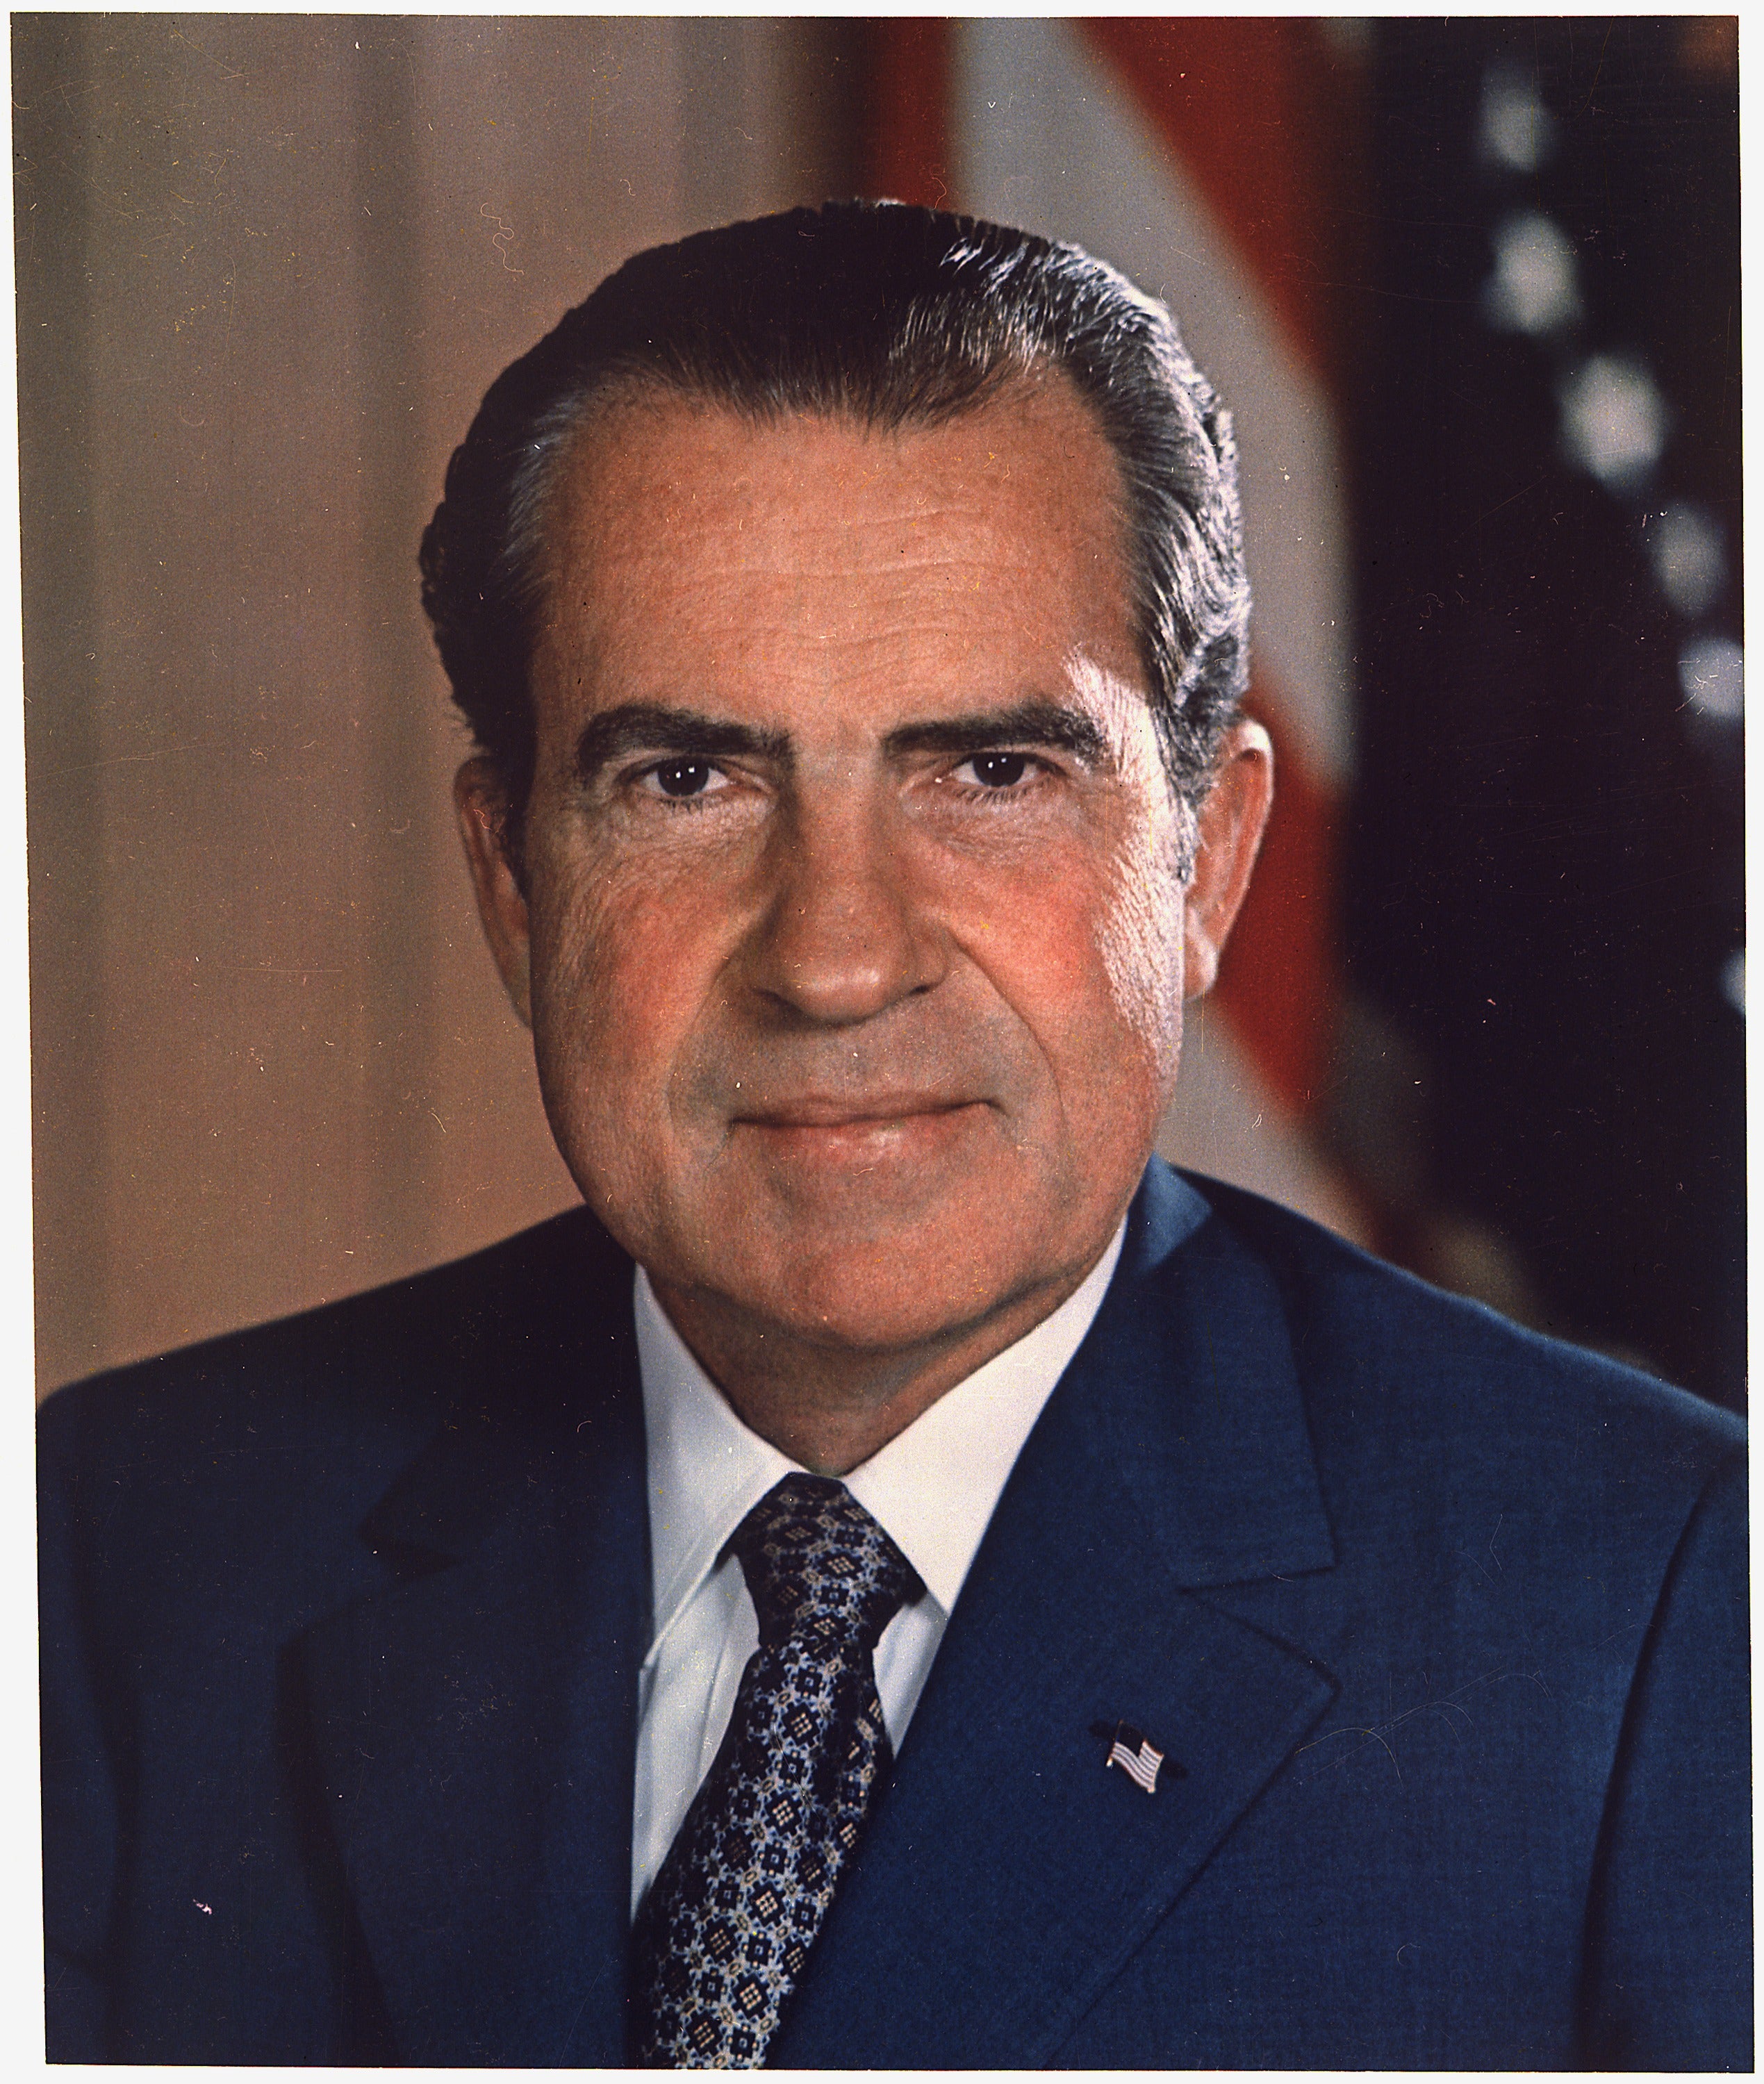
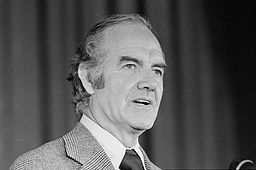
| RICHARD M. NIXON | GEORGE McGOVERN | ||||||||||||||||||||||||||||||||||||
| STATE | TOTAL VOTES | Republican | Democrat | ||||||||||||||||||||||||||||||||||
| Votes | % | EV | Votes | % | EV | ||||||||||||||||||||||||||||||||
| Alabama | 1,006,111 | 728,701 | 72.4 | 9 | 256,923 | 25.5 | |||||||||||||||||||||||||||||||
| Alaska | 95,219 | 55,349 | 58.1 | 3 | 32,967 | 34.6 | |||||||||||||||||||||||||||||||
| Arizona | 622,926 | 402,812 | 64.7 | 6 | 198,540 | 31.9 | |||||||||||||||||||||||||||||||
| Arkansas | 651,320 | 448,541 | 68.9 | 6 | 199,892 | 30.7 | |||||||||||||||||||||||||||||||
| California | 8,367,862 | 4,602,096 | 55.0 | 45 | 3,475,847 | 41.5 | |||||||||||||||||||||||||||||||
| Colorado | 953,884 | 597,189 | 62.6 | 7 | 329,980 | 34.6 | |||||||||||||||||||||||||||||||
| Connecticut | 1,384,277 | 810,763 | 58.6 | 8 | 555,498 | 40.1 | |||||||||||||||||||||||||||||||
| Delaware | 235,516 | 140,357 | 59.6 | 3 | 92,283 | 39.2 | |||||||||||||||||||||||||||||||
| Dist. of Col. | 163,421 | 35,226 | 21.6 | 127,627 | 78.1 | 3 | |||||||||||||||||||||||||||||||
| Florida | 2,583,283 | 1,857,759 | 71.9 | 17 | 718,117 | 27.8 | |||||||||||||||||||||||||||||||
| Georgia | 1,174,772 | 881,496 | 75.0 | 12 | 289,529 | 24.6 | |||||||||||||||||||||||||||||||
| Hawaii | 270,274 | 168,865 | 62.5 | 4 | 101,409 | 37.5 | |||||||||||||||||||||||||||||||
| Idaho | 310,379 | 199,384 | 64.2 | 4 | 80,826 | 26.0 | |||||||||||||||||||||||||||||||
| Illinois | 4,723,236 | 2,788,179 | 59.0 | 26 | 1,913,472 | 40.5 | |||||||||||||||||||||||||||||||
| Indiana | 2,125,529 | 1,405,154 | 66.1 | 13 | 708,568 | 33.3 | |||||||||||||||||||||||||||||||
| Iowa | 1,225,944 | 706,207 | 57.6 | 8 | 496,206 | 40.5 | |||||||||||||||||||||||||||||||
| Kansas | 916,095 | 619,812 | 67.7 | 7 | 270,287 | 29.5 | |||||||||||||||||||||||||||||||
| Kentucky | 1,067,499 | 676,446 | 63.4 | 9 | 371,159 | 34.8 | |||||||||||||||||||||||||||||||
| Louisiana | 1,051,491 | 686,852 | 65.3 | 10 | 298,142 | 28.4 | |||||||||||||||||||||||||||||||
| Maine | 417,042 | 256,458 | 61.5 | 4 | 160,584 | 38.5 | |||||||||||||||||||||||||||||||
| Maryland | 1,353,812 | 829,305 | 61.3 | 10 | 505,781 | 37.4 | |||||||||||||||||||||||||||||||
| Massachusetts | 2,458,756 | 1,112,078 | 45.2 | 1,332,540 | 54.2 | 14 | |||||||||||||||||||||||||||||||
| Michigan | 3,489,727 | 1,961,721 | 56.2 | 21 | 1,459,435 | 41.8 | |||||||||||||||||||||||||||||||
| Minnesota | 1,741,652 | 898,269 | 51.6 | 10 | 802,346 | 46.1 | |||||||||||||||||||||||||||||||
| Mississippi | 645,963 | 505,125 | 78.2 | 7 | 126,782 | 19.6 | |||||||||||||||||||||||||||||||
| Missouri | 1,855,803 | 1,153,852 | 62.2 | 12 | 697,147 | 37.6 | |||||||||||||||||||||||||||||||
| Montana | 317,603 | 183,976 | 57.9 | 4 | 120,197 | 37.8 | |||||||||||||||||||||||||||||||
| Nebraska | 576,289 | 406,298 | 70.5 | 5 | 169,991 | 29.5 | |||||||||||||||||||||||||||||||
| Nevada | 181,766 | 115,750 | 63.7 | 3 | 66,016 | 36.3 | |||||||||||||||||||||||||||||||
| New Hampshire | 334,055 | 213,724 | 64.0 | 4 | 116,435 | 34.9 | |||||||||||||||||||||||||||||||
| New Jersey | 2,997,229 | 1,845,502 | 61.6 | 17 | 1,102,211 | 36.8 | |||||||||||||||||||||||||||||||
| New Mexico | 386,241 | 235,606 | 61.0 | 4 | 141,084 | 36.5 | |||||||||||||||||||||||||||||||
| New York | 7,165,919 | 4,192,778 | 58.5 | 41 | 2,951,084 | 41.2 | |||||||||||||||||||||||||||||||
| North Carolina | 1,518,612 | 1,054,889 | 69.5 | 13 | 438,705 | 28.9 | |||||||||||||||||||||||||||||||
| North Dakota | 280,514 | 174,109 | 62.1 | 3 | 100,384 | 35.8 | |||||||||||||||||||||||||||||||
| Ohio | 4,094,787 | 2,441,827 | 59.6 | 25 | 1,558,889 | 38.1 | |||||||||||||||||||||||||||||||
| Oklahoma | 1,029,900 | 759,025 | 73.7 | 8 | 247,147 | 24.0 | |||||||||||||||||||||||||||||||
| Oregon | 927,946 | 486,686 | 52.4 | 6 | 392,760 | 42.3 | |||||||||||||||||||||||||||||||
| Pennsylvania | 4,592,106 | 2,714,521 | 59.1 | 27 | 1,796,951 | 39.1 | |||||||||||||||||||||||||||||||
| Rhode Island | 415,808 | 220,383 | 53.0 | 4 | 194,645 | 46.8 | |||||||||||||||||||||||||||||||
| South Carolina | 673,960 | 477,044 | 70.8 | 8 | 186,824 | 27.7 | |||||||||||||||||||||||||||||||
| South Dakota | 307,415 | 166,476 | 54.2 | 4 | 139,945 | 45.5 | |||||||||||||||||||||||||||||||
| Tennessee | 1,201,182 | 813,147 | 67.7 | 10 | 357,293 | 29.7 | |||||||||||||||||||||||||||||||
| Texas | 3,471,281 | 2,298,896 | 66.2 | 26 | 1,154,289 | 33.3 | |||||||||||||||||||||||||||||||
| Utah | 478,476 | 323,643 | 67.6 | 4 | 126,284 | 26.4 | |||||||||||||||||||||||||||||||
| Vermont | 186,947 | 117,149 | 62.7 | 3 | 68,174 | 36.5 | |||||||||||||||||||||||||||||||
| Virginia* | 1,457,019 | 988,493 | 67.8 | 11* | 438,887 | 30.1 | |||||||||||||||||||||||||||||||
| Washington | 1,470,847 | 837,135 | 56.9 | 9 | 568,334 | 38.6 | |||||||||||||||||||||||||||||||
| West Virginia | 762,399 | 484,964 | 63.6 | 6 | 277,435 | 36.4 | |||||||||||||||||||||||||||||||
| Wisconsin | 1,852,890 | 989,430 | 53.4 | 11 | 810,174 | 43.7 | |||||||||||||||||||||||||||||||
| Wyoming | 145,570 | 100,464 | 69.0 | 3 | 44,358 | 30.5 | |||||||||||||||||||||||||||||||
| Totals | 77,718,554 | 47,169,911 | 60.7 | 520 | 29,170,383 | 37.5 | 17 | ||||||||||||||||||||||||||||||
| * John Hospers (Libertarian) received one electoral vote from a faithless elector in Virginia | |||||||||||||||||||||||||||||||||||||
| Party | Nominees | Electoral Vote | Popular Vote | ||||||||||||||||||||||||||||||||||
| Presidential | Vice Presidential | ||||||||||||||||||||||||||||||||||||
| Republican |  |
Richard M. Nixon | Spiro Agnew | 520 | 96.7% | 47,169,911 | 60.7% | ||||||||||||||||||||||||||||||
| Democratic | George McGovern | Sargent Shriver | 17 | 3.2% | 29,170,383 | 37.5% | |||||||||||||||||||||||||||||||