To view a PDF of slides presented during PRRI’s May 2, 2024, webinar on this report, please click here. For a replay of the PRRI webinar via YouTube, please click here.
Executive Summary
Nearly two-thirds of Americans support abortion legality in all or most cases; partisans remain deeply divided.
- More than six in ten Americans (64%) say abortion should be legal in most or all cases; by contrast, 35% of Americans say abortion should be illegal in most or all cases.
- Just 9% of Americans believe that abortion should be illegal in all cases.
- Republicans and Democrats are deeply divided on abortion, with a 50-point gap between them: 86% of Democrats say abortion should be legal in all or most cases, compared with 36% of Republicans. Just 15% of Republicans believe abortion should be illegal in all cases.
- While Republican attitudes on abortion legality remain largely unchanged since 2010, Democratic support for abortion legality increased from 71% in 2010 to 86% in 2023; Support for abortion legality has also increased among independents over time, from 54% in 2010 to 67% in 2023.
A slight gender gap has emerged among Americans with respect to abortion rights, a change from earlier polling.
- More than six in ten men (62%) and two-thirds of women (66%) say abortion should be legal in all or most cases.
- Overall, there is no gender gap between Democratic women (86%) and Democratic men (86%); however, Democratic women ages 18 to 29 support abortion legality (92%) at higher rates than young Democratic men (86%).
- As of 2023, Republican women (39%) are more likely than Republican men (34%) to say abortion should be legal in all or most cases. In 2010, by contrast, Republican women were slightly less supportive of abortion legality (33%) than Republican men (36%).
- Independent women are slightly more supportive of abortion legality (69%) than independent men (65%).
Most people of faith support abortion legality.
- The only major religious groups in which a majority do not support abortion legality in all or most cases are white evangelical Protestants (27%), Latter-day Saints (30%), and Jehovah’s Witnesses (25%).
- Majorities across most religious traditions say that abortion should be legal in all or most cases, including Unitarian Universalists (93%), Jewish Americans (81%), Buddhists (79%), other Catholics of color (73%), Black Protestants (71%), white mainline/non-evangelical Protestants (68%), white Catholics (62%), Muslims (60%), Hispanic Catholics (57%), and other Protestants of color (52%).
- Among religiously unaffiliated Americans, 87% say that abortion should be legal in most or all cases.
A majority of residents in most states say that abortion should be legal; in no state do more than 16% of Americans support a ban on abortion.
- A majority of residents in most states say that abortion should be legal in all or most cases; there are only five states where a minority of residents support abortion legality.
- Roughly one in ten residents in most states say abortion should be illegal in all cases. This belief is most common in Kentucky and North Dakota (both 16%).
- Majorities of residents in blue states (70%) and red states (57%) and nearly two-thirds (64%) of residents in battleground states (Arizona, Georgia, Michigan, Nevada, North Carolina, Pennsylvania, and Wisconsin) say that abortion should be legal in all or most cases.
Abortion has become a more salient voting issue in the last five years; Democrats continue to prioritize abortion as a voting issue compared with Republicans, as do women and younger voters.
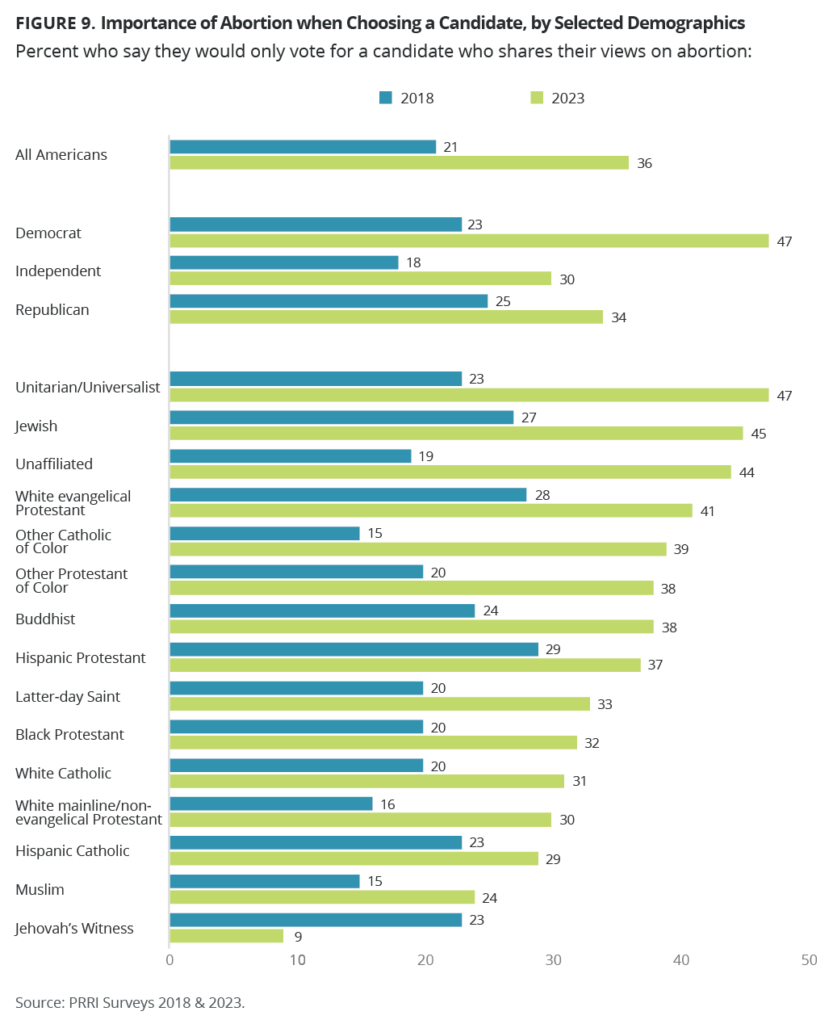
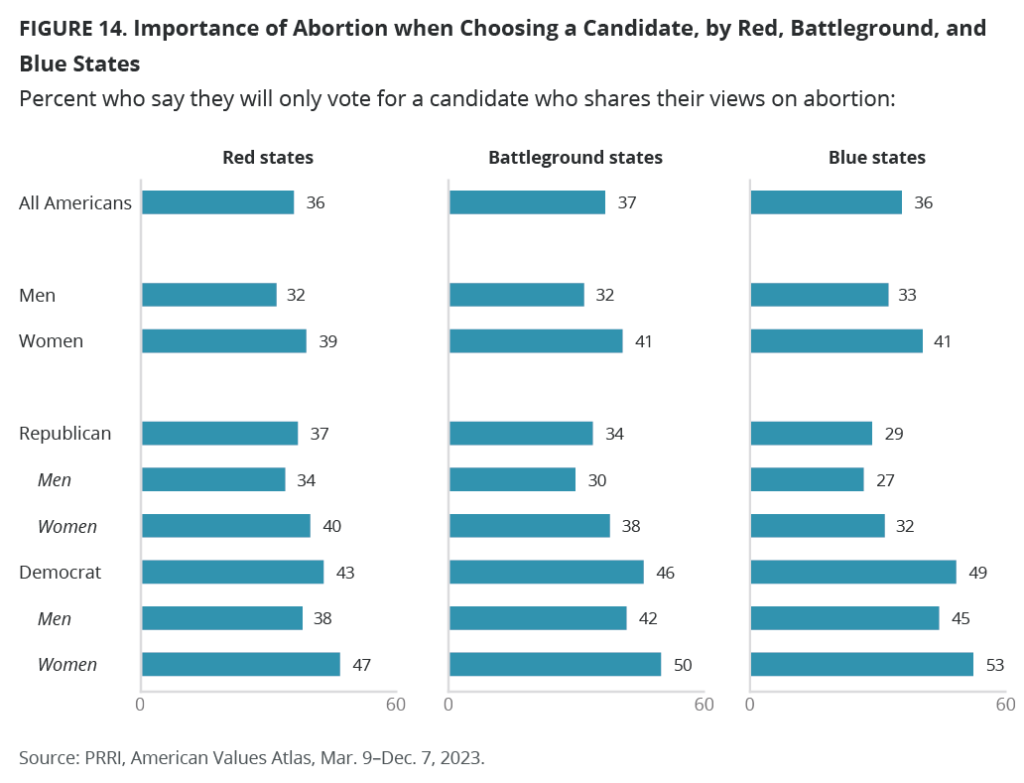
- Over one-third of Americans (36%) say they would only vote for a candidate who shares their views on abortion. In 2018, a notably lower number of Americans (21%) said they would only vote for a candidate who shares their views on abortion.
- Democrats (47%) are more likely than Republicans (34%) to say that they would only vote for a candidate who shares their views on abortion; in 2018, about one-fourth of both Democrats (23%) and Republicans (25%) said they would only vote for a candidate who shares their views on abortion.
- Women (40%) are more likely than men (32%) to say that they would only vote for a candidate who shares their view on abortion.
- More than four in ten young Americans ages 18 to 29 (43%) say they will only vote for a candidate who shares their views on abortion; 53% of Democrats 18 to 29 report that they would only vote for a candidate who shares their views, compared with 41% of Republicans in that age group.
In battleground states, Democrats and women prioritize abortion as a voting issue more than Republicans and men.
- Democrats are 12 percentage points more likely than Republicans in battleground states to say that they will only vote for a candidate who shares their abortion views (46% vs. 34%).
- Women in battleground states are 9 points more likely than men (41% vs. 32%) to say that they will only vote for a candidate who shares their views on abortion.
- Half of Democratic women in battleground states (50%) say they will only vote for a candidate who shares their views on abortion, compared with 42% of Democratic men in battleground states.
- Similarly, Republican women are more likely than Republican men in battleground states (38% vs. 30%) to say that they will only vote for a candidate who shares their views on abortion.
Most Americans oppose laws that make it illegal to use or receive through the mail FDA-approved drugs for medical abortion, including a majority of Republicans.
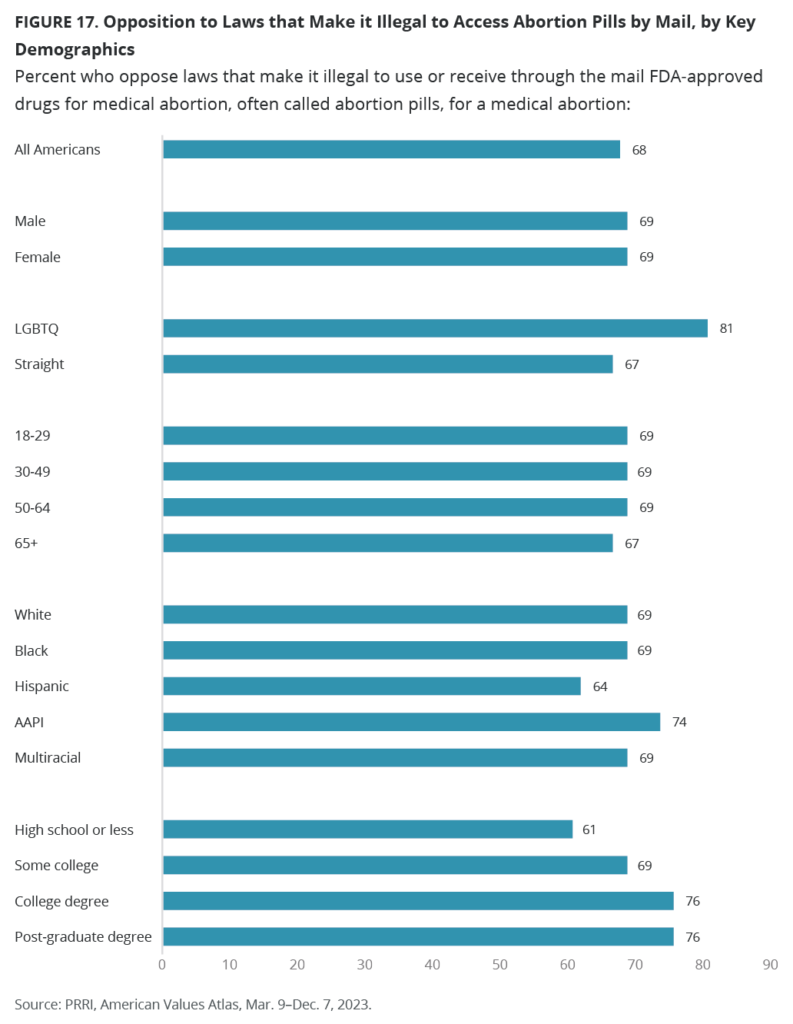
- Among all Americans, over two-thirds (68%) oppose laws that make it illegal to use or receive through the mail FDA-approved drugs for medical abortion, often called abortion pills, while about three in ten (29%) favor these laws.
- Democrats (79%) and independents (71%) are significantly more likely than Republicans (54%) to oppose laws that make it illegal to use or receive abortion pills through the mail.
- Majorities across all religious groups oppose laws that make it illegal to access abortion pills by mail, but Latter-day Saints (53%) and white evangelical Protestants (51%) are the least likely to oppose such laws.
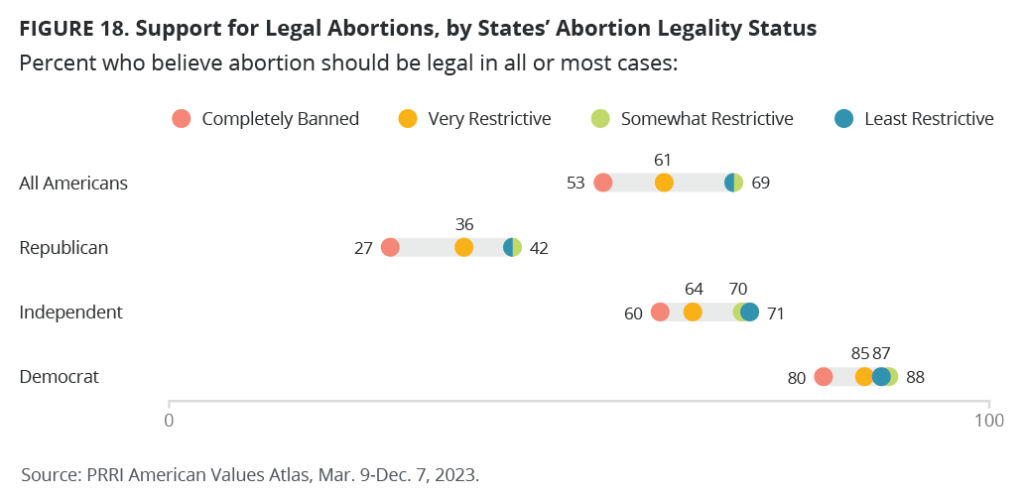
Majorities of Americans living in states where abortion is currently banned support abortion legality; support for abortion legality is higher in states where abortion regulations are the least restrictive.
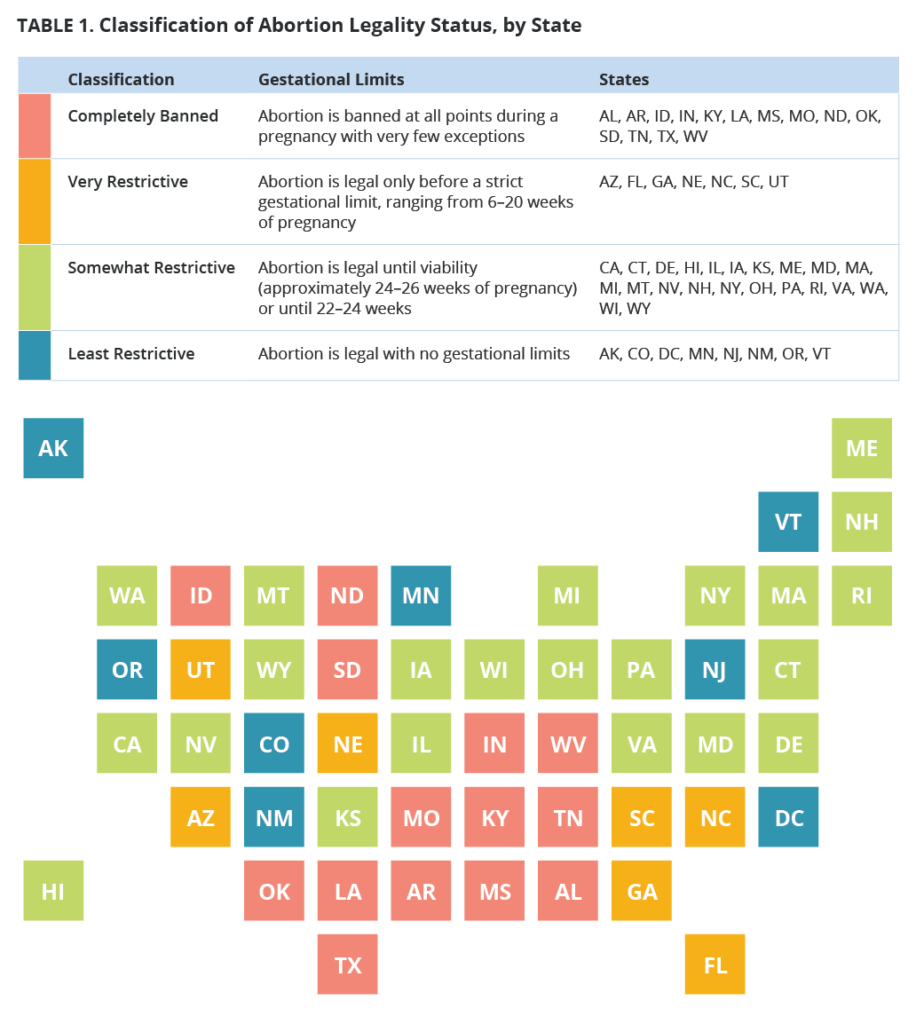
- We divide states into four groups based on the current legal status of abortion as of the end of 2023: states where abortion is (1) completely banned, (2) very restrictive in terms of gestational limits, (3) somewhat restrictive based on gestational limits, or (4) least restrictive.
- Nearly seven in ten Americans in states that are the least restrictive (69%) or somewhat restrictive (69%) say that abortion should be legal in all or most cases, compared with 61% of Americans in states that are very restrictive and 53% of Americans in states where abortion is completely banned.
- Republicans in states where abortion is least restrictive (42%) or somewhat restrictive (42%) are more likely than Republicans in states where abortion is very restrictive (36%) or completely banned (27%) to say abortion should be legal.
- Seven in ten independents in states that are the least restrictive (71%) or somewhat restrictive (70%) believe abortion should be legal, compared with 64% of independents in states where abortion is very restricted or 60% of independents in states where abortion is completely banned.
There is a distinct connection between Christian nationalism and support or opposition to abortion policies in all states.
- Christian nationalism Rejecters nearly unanimously (93%) support the legality of abortion in all or most cases, as do two-thirds of Christian nationalism Skeptics (67%). In comparison, 40% of Christian nationalism Sympathizers and only one-quarter (25%) of Christian nationalism Adherents say the same.
- When examining Christian nationalism Adherents’ and Sympathizers’ views on abortion by racial groups, Black Christian nationalism Adherents and Sympathizers (59%) are about twice as likely as Hispanic Christian nationalism Adherents and Sympathizers (34%) and white Christian nationalism Adherents and Sympathizers (29%) to say abortion should be legal in all or most cases.
- In all 50 states, overall, the higher a state’s residents scored on the Christian nationalism scale, the less likely they are to support abortion legality.
Introduction
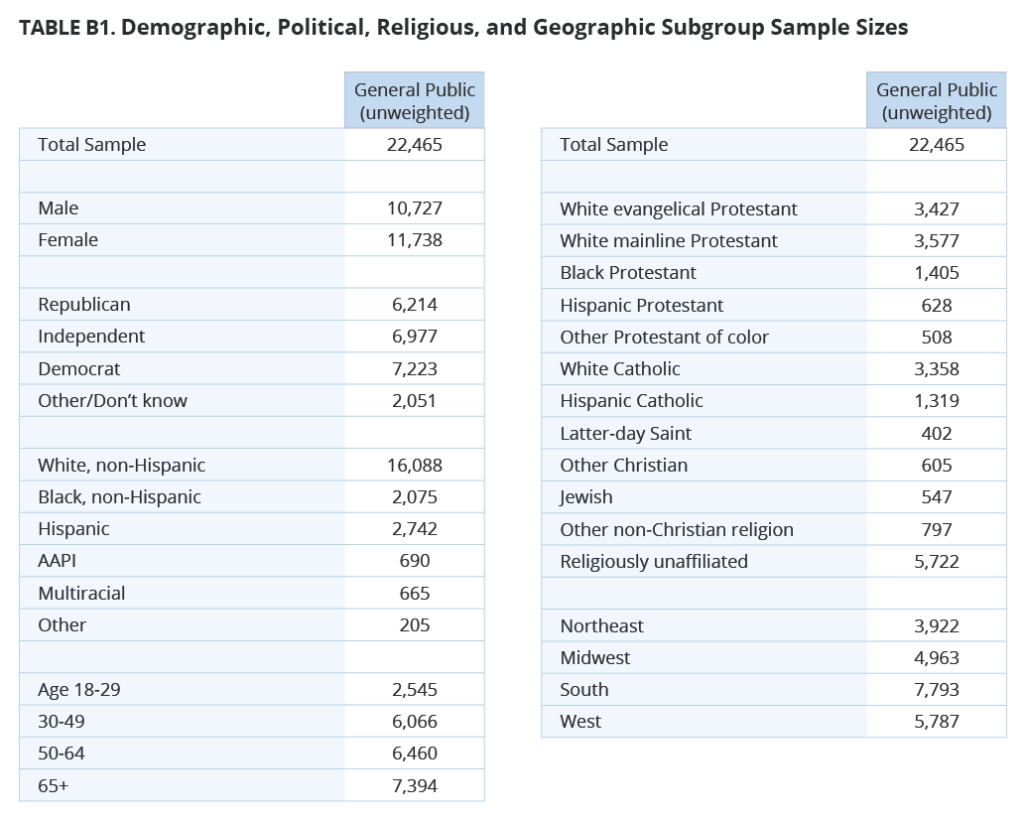
Throughout 2023, PRRI interviewed more than 22,000 adults as part of its American Values Atlas, allowing for the ability to provide a detailed profile of the demographic, religious, and political characteristics of Americans and their views on abortion. As in years past, this analysis measures Americans’ attitudes toward the legality of abortion, views on abortion pills, and how much abortion matters for voting. This year’s report also includes new analysis of the intersection between Christian nationalist views and abortion legality in each state.
Abortion Legality
More than six in ten Americans (64%) say abortion should be legal in most or all cases, marking the fourth consecutive year in which at least 60% of Americans favor abortion legality. By contrast, 35% of Americans say abortion should be illegal in most or all cases; however, this includes just 9% of Americans who believe that abortion should be illegal in all cases.
Party Affiliation
Republicans and Democrats are deeply divided on abortion, with a 50-point gap between them. More than eight in ten Democrats (86%) say abortion should be legal in all or most cases. A little more than one-third of Republicans (36%) say they support abortion in all or most cases. Independents (67%) resemble all Americans (64%); although since 2019, they tend to be more supportive of abortion legality.
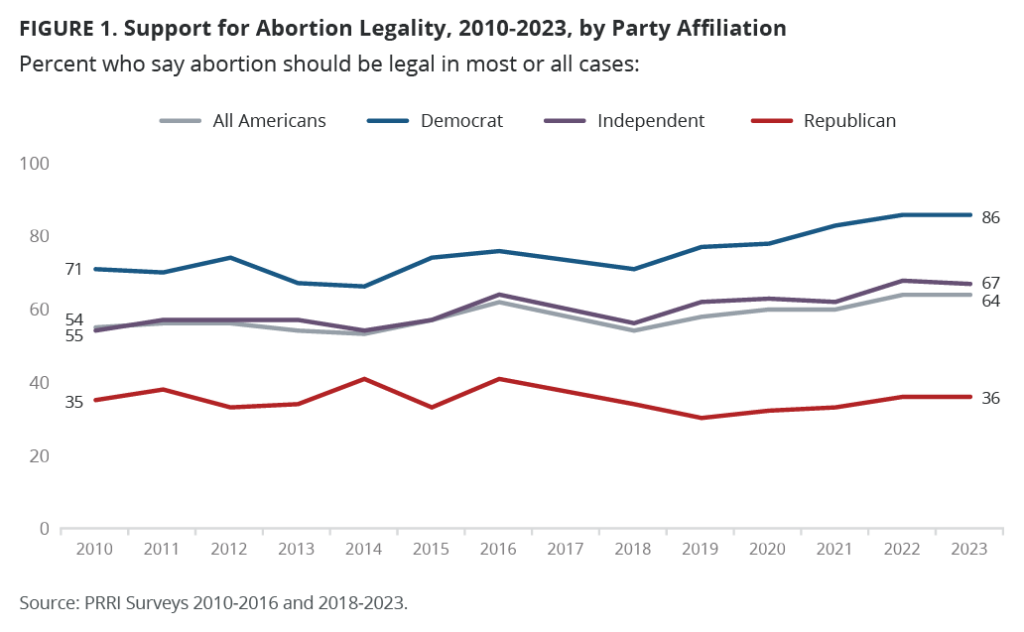
Democrats have consistently been in favor of abortion rights, though their support has increased in recent years. Since 2010, at least two-thirds of Democrats have supported a woman’s right to abortion in all or most cases, ranging from a low of 66% in 2014 to a high of 86% in 2022 and 2023.
Most Republicans are opposed to abortion rights, with a minority who say abortion should be legal in all or most cases. Around one-third of Republicans support abortion rights (36% in 2023), with support ranging from a low of 30% in 2019 to a high of 41% in 2014 and 2016. Independents closely mirror all Americans.
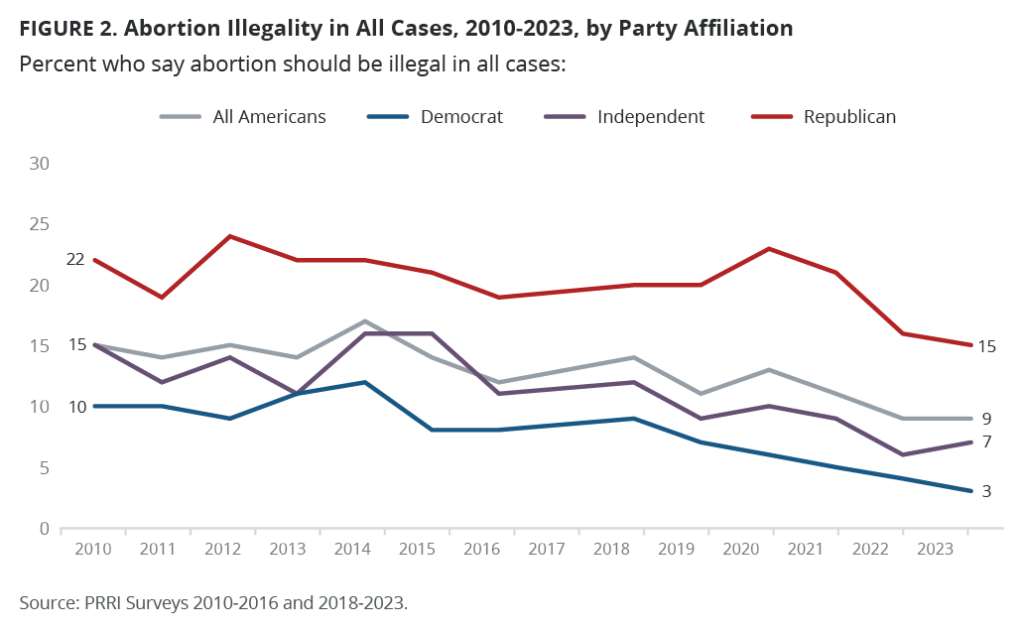
Looking at the opposing viewpoint, the share of Americans who say abortion should be illegal in all cases has declined since 2010. However, the percentage of Republicans who say abortion should be illegal in all cases has stabilized over the last year, from 16% in December 2022 to 15% in December 2023.
Gender, Age, Party, and Race
More than six in ten men (62%) and two-thirds of women (66%) say abortion should be legal in all or most cases. Since 2010, men and women have largely supported abortion rights at similar rates, though women have become slightly more supportive of abortion legality than men in recent years. Republican women (39%) are more likely than Republican men (34%) to say abortion should be legal, while no such gap exists between Democratic women (86%) and Democratic men (86%). Independent women are slightly more supportive of abortion legality (69%) than independent men (65%).
More than six in ten Americans from all age groups say abortion should be legal in all or most cases, including two-thirds in ten young adults ages 18-29 (67%) and 61% of seniors. Though a majority of younger Americans have supported abortion rights since 2010, this was not always the case among Americans ages 65 and older. In 2010, under half of American seniors (47%) supported abortion rights.
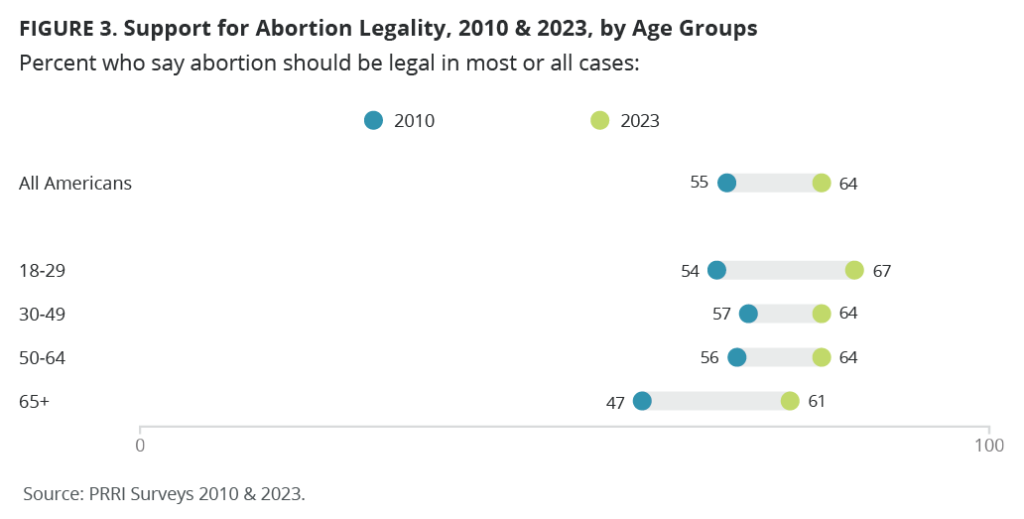
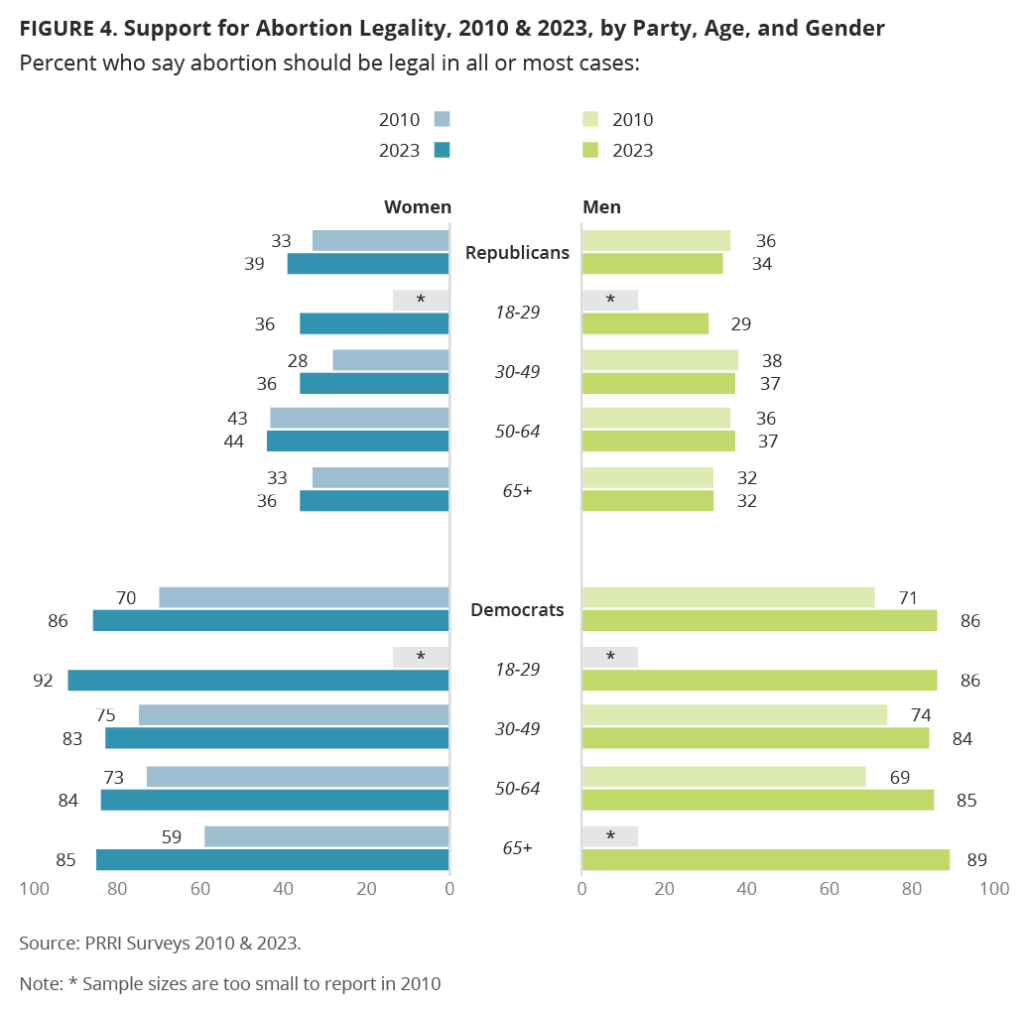
A majority of men and women of all age cohorts say that abortion should be legal in all or most cases. For the most part, men and women in each age cohort say abortion should be legal at similar rates. In 2010, a minority of senior men and women said that abortion should be legal (47% each), but in 2023, a majority of senior men (61%) and women (62%) say abortion should be legal in all or most cases. There are, however, substantial differences by partisanship. Democratic senior men (89%) and women (85%) are about 50 percentage points more likely than senior Republican men (32%) and women (36%) to support the legality of abortion. The same pattern takes place across all age groups. Democratic men and women in each age cohort are more likely than Republican men and women to support the legality of abortion, but especially young Democratic women.
In 2023, more than nine in ten Democratic young women (92%) and 86% of Democratic young men say abortion should be legal in all or most cases, compared with 36% of young Republican women and 29% of young Republican men. Similarly, over eight in ten Democratic women and men ages 30-49 (83% and 84%, respectively) and ages 50-64 (84% and 85%, respectively) say abortion should be legal in all or most cases, compared with 36% and 37% of Republican women and men ages 30-49, respectively, as well as 44% of Republican women ages 50-64, who are 7 percentage points more likely than their male counterparts (37%) to support the legality of abortion.
A solid majority of LGBTQ Americans (82%) say abortion should be legal in all or most cases, compared with 62% of Americans who identify as straight.
Black Americans (71%), Asian Americans and Pacific Islanders (74%) are notably more likely than multiracial Americans (65%), white Americans (63%), and Hispanic Americans (59%) to say that abortion should be legal in all or most cases.
Religious Traditions
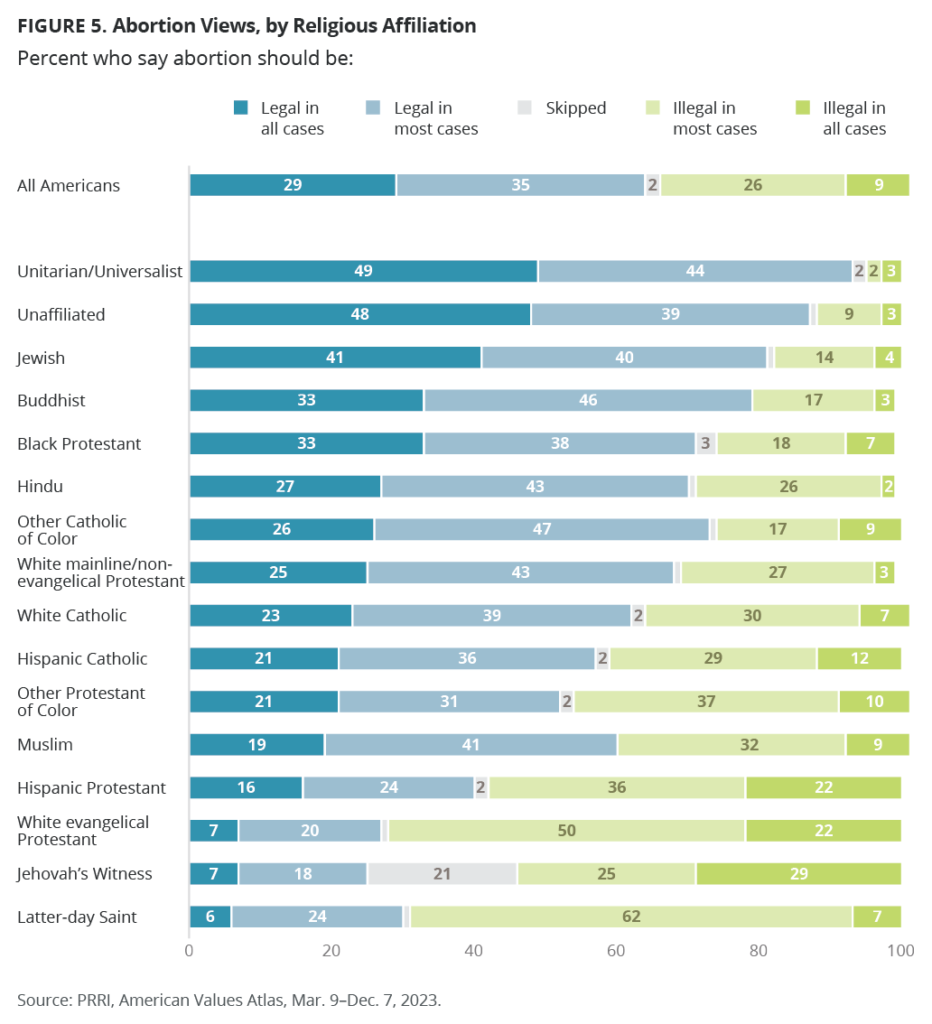
Majorities across most religious traditions say that abortion should be legal in all or most cases, including Unitarian Universalists (93%), Jewish Americans (81%), Buddhists (79%), other Catholics of color (73%), Black Protestants (71%), white mainline/non-evangelical Protestants (68%), white Catholics (62%), Muslims (60%), Hispanic Catholics (57%), and other Protestants of color (52%). By contrast, Jehovah’s Witnesses (25%), white evangelical Protestants (27%), Latter-day Saints (30%), and Hispanic Protestants (40%) are the only major religious groups in which less than half of adherents support the legality of abortion. Among religiously unaffiliated Americans, 87% say that abortion should be legal in most or all cases.
Support for the Legality of Abortion by State
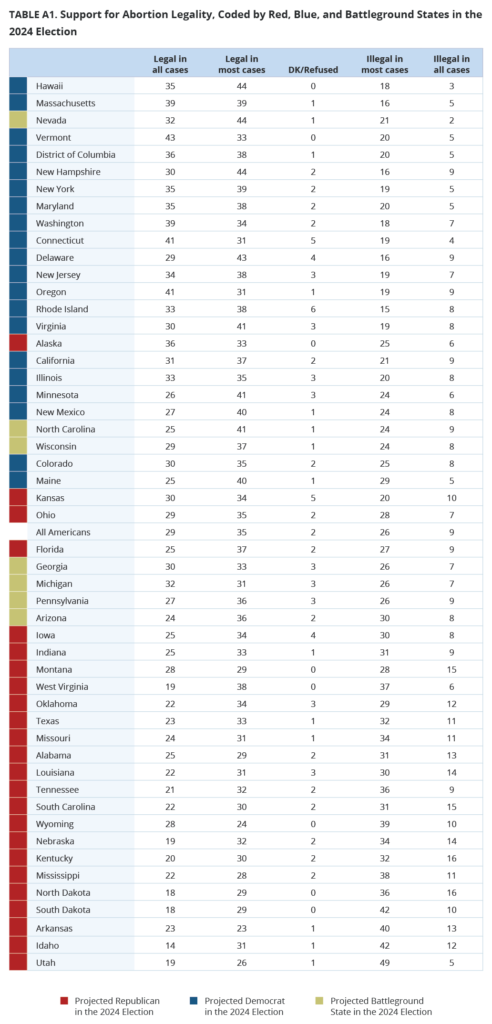
A majority of residents in most states say that abortion should be legal in all or most cases. In four states, at least three-quarters of residents support abortion rights. These include Hawaii (79%), Massachusetts (78%), Nevada (76%), and Vermont (76%). In an additional 10 states and the District of Columbia, between 70% and 74% of residents say abortion should be legal in all or most cases: District of Columbia (74%), New Hampshire (74%), New York (74%), Maryland (73%), Washington (73%), Connecticut (72%), Delaware (72%), New Jersey (72%), Oregon (72%), Rhode Island (71%), and Virginia (71%). At 68%, Illinois is the Midwestern state with the highest share of residents who say abortion should be legal in all or most cases.
By contrast, there are five states where a minority of residents support abortion. Forty-seven percent of residents in North and South Dakota, 46% in Arkansas, and 45% in Idaho and Utah say abortion should be legal in all or most cases.
Roughly one in ten residents in most states say abortion should be illegal in all cases. This belief is most common in Kentucky and North Dakota (both 16%). Additionally, 15% of residents in Montana and South Carolina, 14% of residents in Louisiana and Nebraska, 13% of residents in Alabama and Arkansas, 12% of residents in Idaho and Oklahoma, and 11% of residents in Mississippi, Missouri, and Texas say that abortion should be illegal in all cases.
Support for Legality of Abortion in Red, Blue, and Battleground States
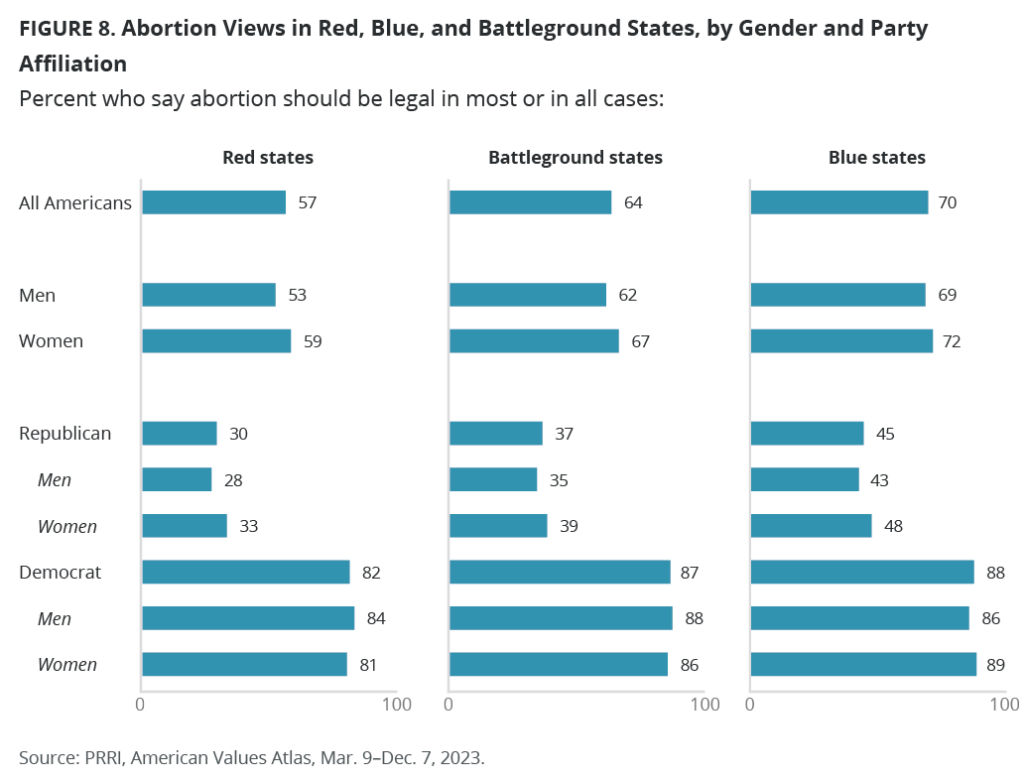
Majorities of residents in blue states (70%), battleground states (64%), and even red states (57%) support the legality of abortion. [1] Nearly two-thirds (64%) of residents in the battleground states of Arizona, Georgia, Michigan, Nevada, North Carolina, Pennsylvania, and Wisconsin say that abortion should be legal in all or most cases. In these states, majorities of most demographic and religious groups say abortion should be legal in all or most cases.
Two-thirds of women (67%) and more than six in ten men (62%) in battleground states say abortion should be legal. In blue states, women are about as likely as men to support the legality of abortion (72% vs. 69%). There is a slight gender gap in red states: 59% of women vs. 53% of men support the legality of abortion.
Even though partisans in red states are less likely than those in blue and battleground states to support the legality of abortion, majorities still support abortion legality, except for Republicans: 82% of Democrats and 61% of independents in red states, compared with 87% of Democrats and 68% of independents in battleground states, and 88% of Democrats and 71% of independents in blue states. Republican residents in blue states (45%) are more likely than Republicans in battleground states (37%) and red states (30%) to say abortion should be legal in all or most cases.
Except for white evangelical Protestants, solid majorities of most other religious groups including white mainline/non-evangelical Protestants, white Catholics, Black Protestants, non-Christians, and unaffiliated Americans support the legality of abortion, but those in blue states are more likely to do so than those in red states. Even white evangelical Protestants in blue states (31%) and battleground states (30%) are more likely than white evangelical Protestants in red states (24%) to say that abortion should be legal in all or most cases.
Voting for a Candidate Who Shares Views on Abortion
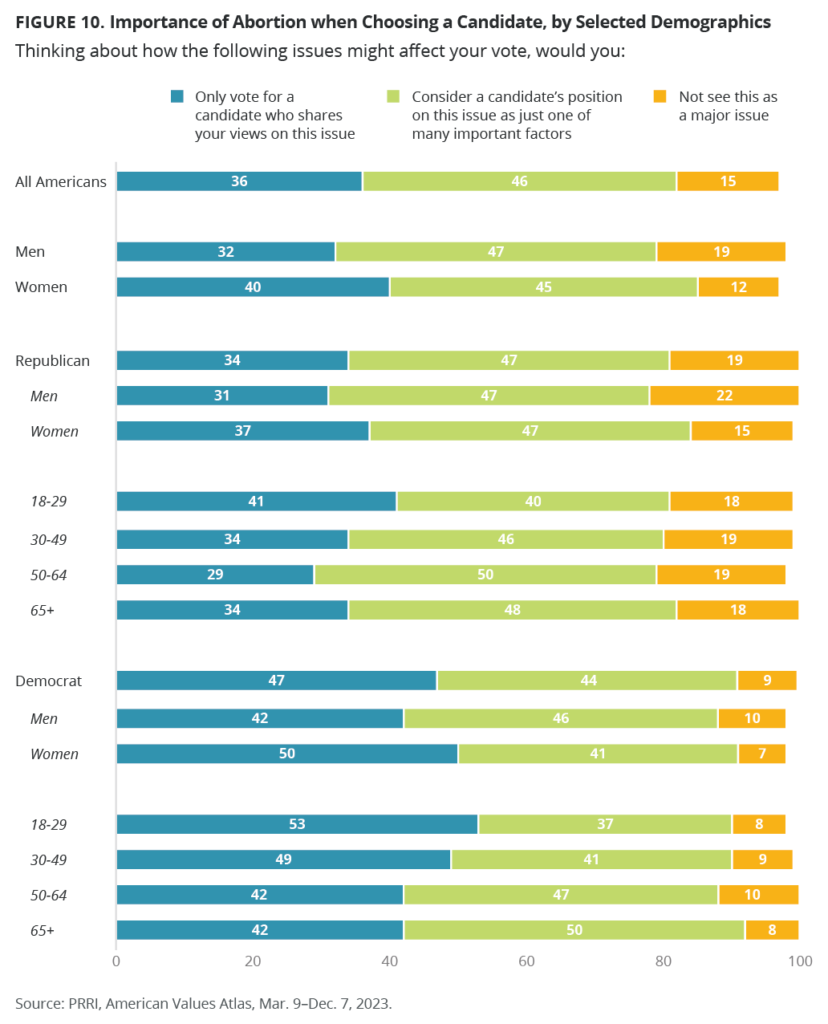
Over one-third of Americans (36%) say they would only vote for a candidate who shares their views on abortion, compared with 46% who say they would consider a candidate’s position on abortion as just one of many important factors and just 15% who do not see abortion as a major issue. In 2018, when the question was first asked, a notably lower number of Americans (21%) said they would only vote for a candidate who shares their views on abortion, while nearly three in ten (28%) said they don’t see abortion as a major issue. The same number of Americans (46%) said they would consider a candidate’s position on abortion as just one of many important factors in 2018.
Party and Religious Affiliation
Democrats (47%) are more likely than Republicans (34%) to say that they would only vote for a candidate who shares their views on abortion. Republicans (19%) are more than twice as likely as Democrats (9%) to say abortion is not a major issue affecting their vote. In 2018, about one in four of both Democrats (23%) and Republicans (25%) said they would only vote for a candidate who shares their views on abortion.
Unitarian Universalists (47%), Jewish Americans (45%), unaffiliated Americans (44%), and white evangelical Protestants (41%) are the most likely to say they would only vote for a candidate who shares their views on abortion. Fewer than four in ten other Catholics of color (39%), other Protestants of color (38%), Buddhists (38%), and Hispanic Protestants (37%) say the same. Similarly, one-third of Latter-day Saints (33%) and Black Protestants (32%), as well as three in ten white Catholics (31%), white mainline/non-evangelical Protestants (30%), Hispanic Catholics (29%), and one in four Muslims (24%) say they would only vote for a candidate who shares their views on abortion. Just 9% of Jehovah’s Witnesses say the same. Except for Jehovah’s Witnesses (23% in 2018), all religious groups have grown more likely to say that they would only vote for a candidate who shares their views on abortion than they did in 2018.
Demographics
Women (40%) are more likely than men (32%) to say that they would only vote for a candidate who shares their abortion views. Men (19%) are more likely than women (12%) to say that abortion is not a major issue in their vote. A slim majority of Americans who identify as LGBTQ (51%) say they would only vote for a candidate who shares their views on abortion, compared with 35% of those who identify as straight.
While there are differences across partisan lines, there are also notable differences between men and women within partisan groups. Both Republican (37%) and Democratic (50%) women are more likely than their male counterparts (31% and 42%, respectively) to report that they would only vote for a candidate who shared their views on abortion.
More than four in ten young people ages 18-29 (43%) say they will only vote for a candidate who shares their views on abortion, compared with roughly one-third of Americans ages 30-49 (37%), ages 50-64 (33%), and ages 65 and over (35%).
Both young Democrats and Republicans are more likely than their older partisan counterparts to say that a candidate must share their views on abortion. Among Democrats, the only age group where the majority report that they would only vote for a candidate who shares their view on abortion is 18-29 (53%). Nearly half of Democrats ages 30-49 (49%) and four in ten Democrats ages 50-64 (42%) and 65 and older (42%) say the same. Among Republicans, those ages 18-29 (41%) are most likely to say they would only vote for a candidate who shared their views on abortion, compared with older Republicans: 34% of Republicans ages 30-49, 29% of Republicans ages 50-64, and 34% of Republicans ages 65 and older.
Racial and ethnic groups are fairly similar regarding the salience of abortion to their vote. Nearly four in ten white and Asian Americans (38%) and about one-third of Hispanic (34%) and Black (33%) Americans say they will only vote for a candidate who shares their views on abortion.
Americans with a high school education or less (34%) are less likely than Americans with a college degree (39%) and with a postgraduate degree (40%) to say they will only vote for a candidate who shares their views on abortion, but do not differ from those with some college (36%).
Voting Preferences Among Abortion Opponents and Supporters
Among people who say that abortion should be legal in all or most cases, 38% say that they will only vote for a candidate who shares their views on the issue. In comparison, 47% say a candidate’s position on abortion is one of many factors they consider, and 15% say they do not see abortion as a major issue.
People who say abortion should be illegal in all or most cases have similar evaluations of candidates, with 36% saying that they will only vote for a candidate who shares their views, 46% who consider a candidate’s position on abortion just one of many factors, and 16% who say it is not a major issue.
By comparison, in 2018, abortion opponents (27%) were 9 percentage points more likely than abortion supporters (18%) to say they would only vote for a candidate who shared their views. However, the salience of abortion as a major issue for evaluating candidates is now more prevalent among Democrats who support abortion rights (50%) than among Republicans who oppose abortion rights (44%).
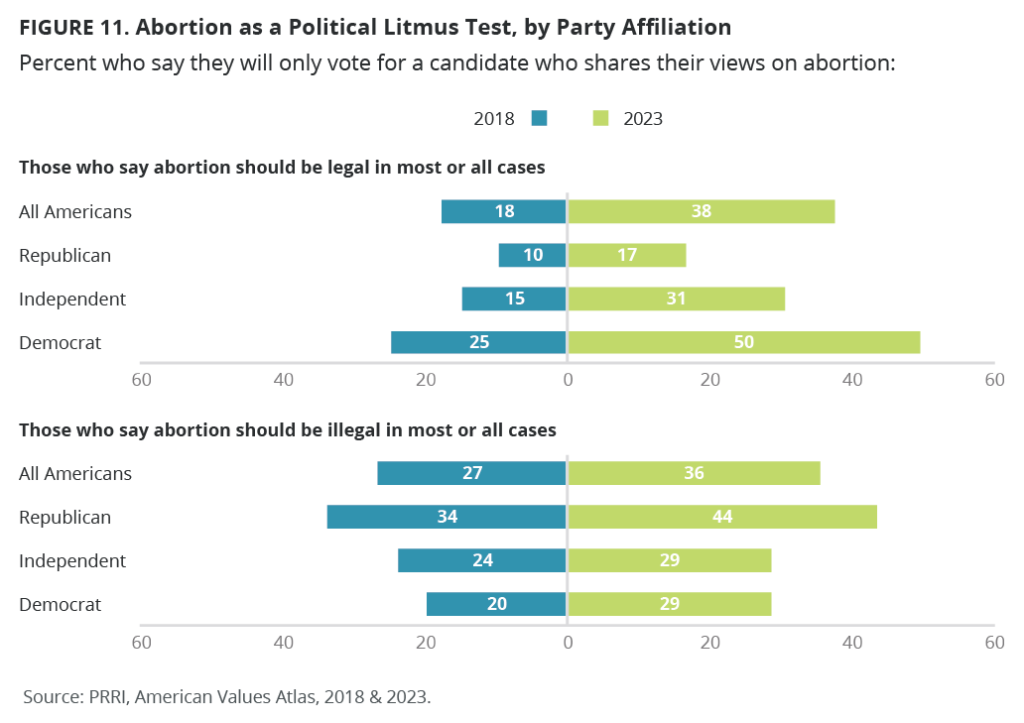
Democrats who say abortion should be legal in all or most cases are twice as likely to say they will only vote for a candidate who shares their views on abortion today (50%) than they did in 2018 (25%). This gap is smaller among Republicans who oppose abortion rights and say they would only vote for a candidate sharing their views about abortion (44% in 2023 vs. 34% in 2018).
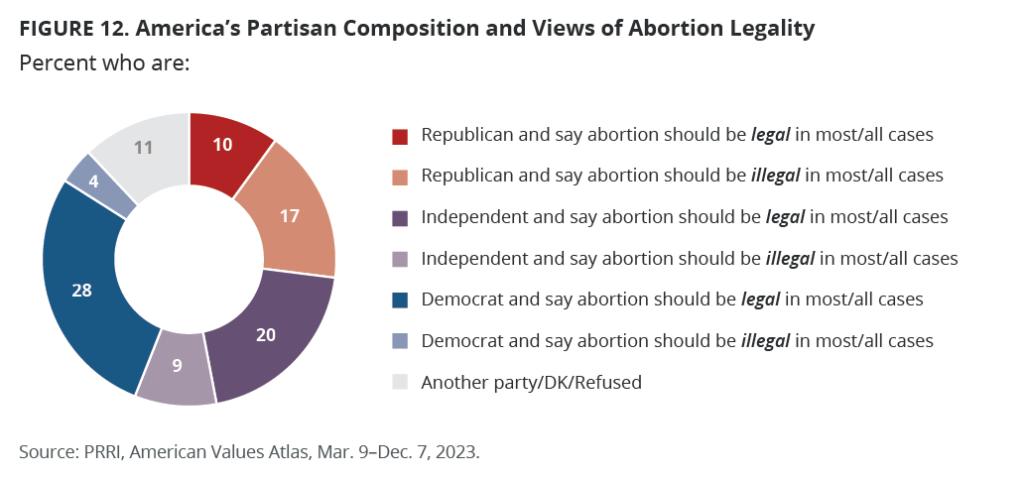
While some proportions of American population who stand at odds with their party’s popular consensus on the legality of abortion, Republicans are more than twice as likely to do so than Democrats. One in ten Americans (10%) identify as Republican but say that abortion should be legal in most or all cases, while 4% identify as Democrats but say abortion should be illegal in most or all cases.
Voting for a Candidate Who Shares Views on Abortion by State
The five states where voters are the most likely to say they will only vote for a candidate who shares their views on abortion are Oregon (48%), Kentucky (47%), Connecticut (44%), Montana, and Vermont (43% each). The states where residents are less likely to say they will only vote for a candidate who shares their views on abortion are Minnesota, Mississippi, Rhode Island, West Virginia (31% each), and Alaska (27%).
Voting Preferences in Red, Blue, and Battleground States
When asked how abortion might affect their vote, over one-third of residents in red states (36%), battleground states (37%), and blue states (37%) say they will only vote for a candidate who shares their views.
Democrats are 20 percentage points more likely than Republicans (49% vs. 29%) in blue states to say that they will only vote for a candidate who shares their abortion views. This gap narrows in battleground states (46% vs. 34%) and differs only by 6 percentage points in red states, where 37% of Republicans say that they will only vote for a candidate who shares their views on abortion, compared with 43% of Democrats.
Abortion matters more to women voters. Women in battleground states are 9 points more likely than men (41% vs. 32%) to say that they will only vote for a candidate who shares their views on abortion, similar to those in blue states (41% vs. 33%), and in red states (39% vs. 32%).
About half or more Democratic women in red states (47%), battleground states (50%), and blue states (53%) say they will only vote for a candidate who shares their views on abortion. Democratic men are less likely to say the same, particularly in red states (38%), compared with those in battleground states (42%) and blue states (45%).
Similarly, Republican women are more likely than Republican men in red states (40% vs. 34%) and battleground states (38% vs. 30%) to say that they will only vote for a candidate who shares their views on abortion; Republican women and men in blue states are less likely to say the same (32% vs. 27%).
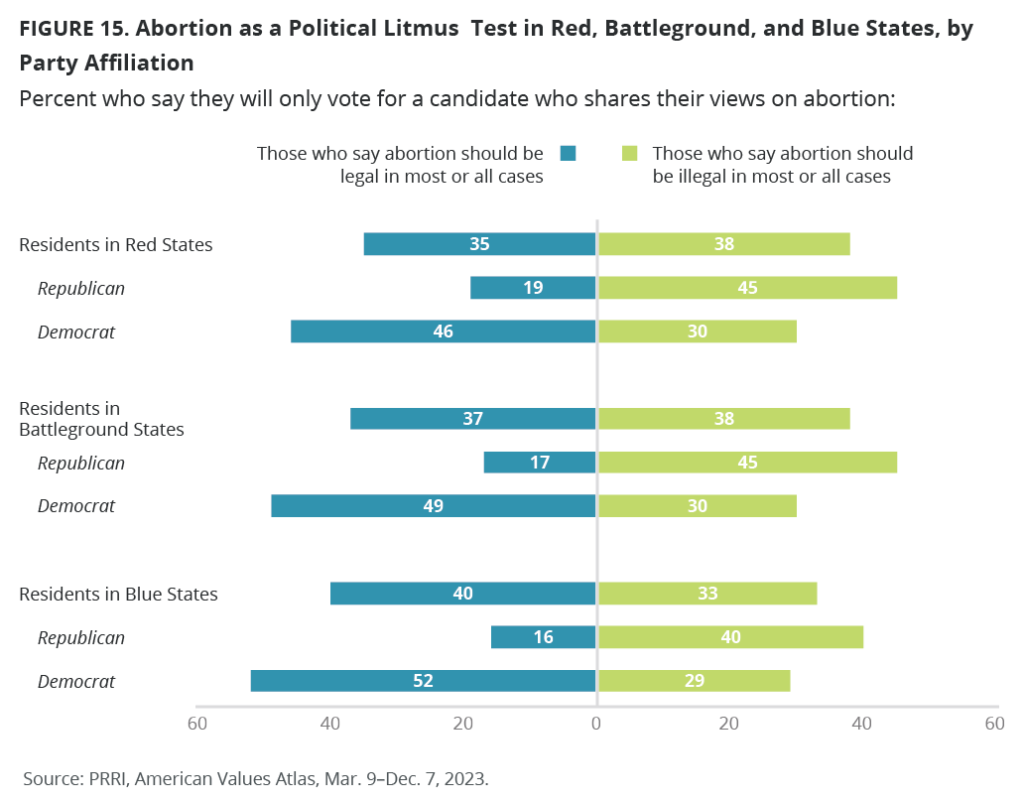
Voting Preferences Among Opponents and Supporters of Abortion in Red, Blue, and Battleground States
Americans living in blue states who say that abortion should be legal in all or most cases are more likely to say they will only vote for a candidate who shares their views than those who say that abortion should be illegal in all or most cases (40% vs. 33%). There are no meaningful differences among Americans living in red states (35% vs. 38%) and battleground states (37% vs. 38%).
Democrats living in blue states (52%) who say that abortion should be legal in all or most cases are more likely to say they will only vote for a candidate who shares their views than those who live in red states (46%) but do not differ from those who live in battleground states (49%). Additionally, abortion matters more in voting among those Democrats who say abortion should be legal in all or most cases than among Democrats living in red states (30%), battleground states (30%), or blue states (29%) who say abortion should be illegal in all or most cases.
By contrast, abortion matters more for voting among Republicans who say that abortion should be illegal in all or most cases, but Republicans living in red states (45%) and battleground states (45%) are slightly more likely to say they will only vote for a candidate who shares their views than Republicans living in blue states (40%). These Republicans are nearly three times as likely to say they will only vote for a candidate who shares their views on abortion than Republicans who say that abortion should be legal in all or most cases living in red states (19%), battleground states (17%), and blue states (16%).
The Abortion Pill
Among all Americans, over two-thirds oppose laws that make it illegal to use or receive through the mail FDA-approved drugs for medical abortion (68%), often called abortion pills, while about three in ten favor these laws (29%). Opposition has gone down by about 4 percentage points from 72% in 2022 when the question was first asked.
Party and Religious Affiliation
Democrats (79%) and independents (71%) are significantly more likely than Republicans (54%) to oppose laws that make it illegal to use or receive abortion pills through the mail. In 2022, a significantly higher percentage of Democrats (85%) opposed these laws, but there are no significant differences over the previous year for Republicans and independents.
Majorities across all religious groups oppose laws that make it illegal to access abortion pills by mail, but Latter-day Saints (53%) and white evangelical Protestants (51%) are the least likely to do so. By contrast, unaffiliated Americans (82%), Jewish Americans (81%), white mainline/non-evangelical Protestants (73%), and other Catholics of color (70%) are the most likely to oppose laws that make it illegal to access abortion pills through the mail. About two-thirds of other Protestants of color (69%), Black Protestants (66%), white Catholics (65%), Hispanic Catholics (63%), and Hispanic Protestants (62%) also oppose these laws.[2] Opposition among Black Protestants and white Catholics decreased significantly between 2022 and 2023 (from 77% to 66% and from 76% to 65%, respectively).
![]()
Demographics
Men and women (69%) equally oppose laws that make it illegal to access abortion pills through mail. Additionally, 81% of LGBTQ individuals oppose these laws, which is significantly higher than those who identify as straight (67%).
There are also no significant differences among age groups, as 69% of those ages 18-29, 30-49, and 50-64 oppose these laws, as do 67% of those ages 65 and older. There was, however, a significant decline in opposition to these laws among those ages 65 and older from 76% in 2022.
Among racial groups, 74% of Asian American and Pacific Islanders oppose laws that make it illegal to access abortion pills through the mail, compared with 69% of white, Black, and multiracial Americans and 64% of Hispanic Americans.
Those with college and postgraduate degrees (both 76%) are significantly more likely than those with some college (69%) or a high school education (61%) to oppose laws that make it illegal to access abortion pills through mail. Additionally, there has been a significant decrease over the previous year in the percentage of those with postgraduate degrees who oppose these laws; in 2022, 81% of this group was in opposition.
Views on Abortion by States’ Abortion Legality Status
Abortion Legality
Although the majority of Americans believe abortion should be legal in all or most cases, many states have either placed restrictions on abortion access or passed legal protections for abortion rights since the overturn of Roe v. Wade. It is worth considering whether public opinion on this issue is consistent across states with similar levels of legal restriction on abortion. We divide states into four groups based on the current legal status of abortion as of the end of 2023: states where abortion is completely banned, very restrictive in terms of gestational limits, somewhat restrictive based on gestational limits, and least restrictive. [3]
Nearly seven in ten Americans in states that are the least restrictive (69%) or somewhat restrictive (69%) say that abortion should be legal in all or most cases, compared with 61% of Americans in states that are very restrictive and 53% of Americans in states where abortion is completely banned.[4]
Republicans in states where abortion is least restrictive (42%) or somewhat restrictive (42%) are more likely than Republicans in states where abortion is very restrictive (36%) or completely banned (27%) to say abortion should be legal. Seven in ten independents in states where abortion is the least restrictive (71%) or somewhat restrictive (70%) believe abortion should be legal, compared with 64% of independents in states where abortion is very restricted or 60% of independents in states where abortion is completely banned. At least eight in ten Democrats in each state category say abortion should be legal.
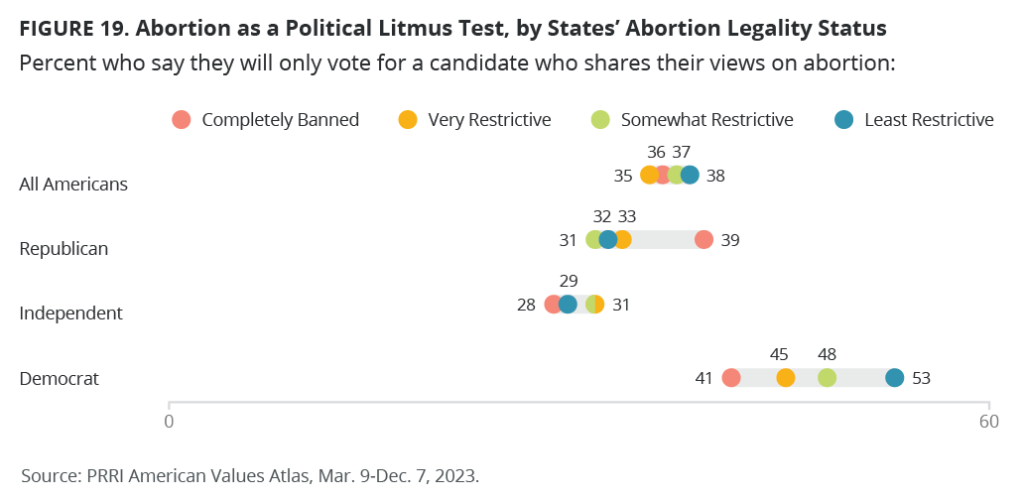
Abortion as a Voting Preference
Fewer than four in ten Americans in each state group say they would only vote for a candidate if they shared their views on abortion. Nearly four in ten Republicans in states where abortion is completely banned (39%) would only vote for a candidate based on their stance on abortion, compared with 33% of those in states that are very restrictive, 31% of those in states that are somewhat restrictive, and 32% of those in states that are least restrictive. Around half of Democrats in states that are least restrictive (53%) or somewhat restrictive (48%), 45% of those in states that are very restrictive, and 41% of those in states where abortion is completely banned would only vote for a candidate who shares their views on abortion.
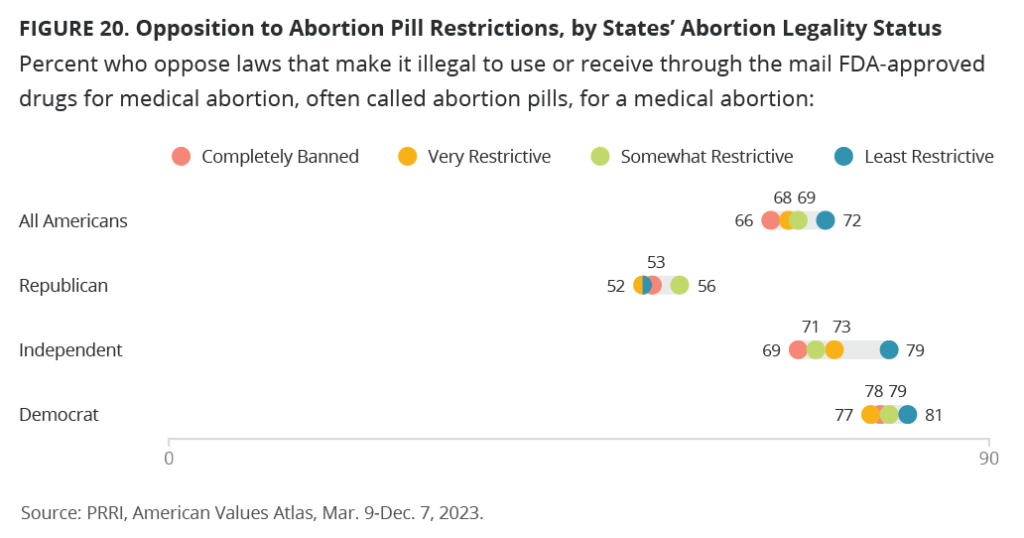
Opposition to Abortion Pill Restrictions
Finally, we explore Americans’ views on abortion pill restrictions. Although there are differences among these state groups on abortion legality, there are little differences in opposition to abortion pill restrictions. Around seven in ten of each group oppose abortion pill restrictions, including 72% of those in states that are least restrictive, 69% of those in states that are somewhat restrictive, 68% of those in states that are very restrictive, and 66% of those in states that abortion is completely banned.
Nearly eight in ten independents in states where abortion is least restricted (79%) oppose abortion pill restrictions, compared with 71% in states that are somewhat restrictive, 73% in states that are very restrictive, and 69% in states where abortion is completely banned. There are little differences among Republicans and Democrats in these state groups.
The Relationship Between Christian Nationalism and Support for Abortion Access
There is a distinct connection between Christian nationalism and support for or opposition to abortion policies in all states. Attitudes toward the two policies discussed in this report have opposite trends depending on people’s affinity for Christian nationalism. PRRI’s Christian nationalism scale, which sorts respondents into four categories based on their response to a battery of five questions gauging different tenets of Christian nationalism, allows us to better understand how people’s adherence or rejection to Christian nationalism relates to support or opposition to abortion access.[5]
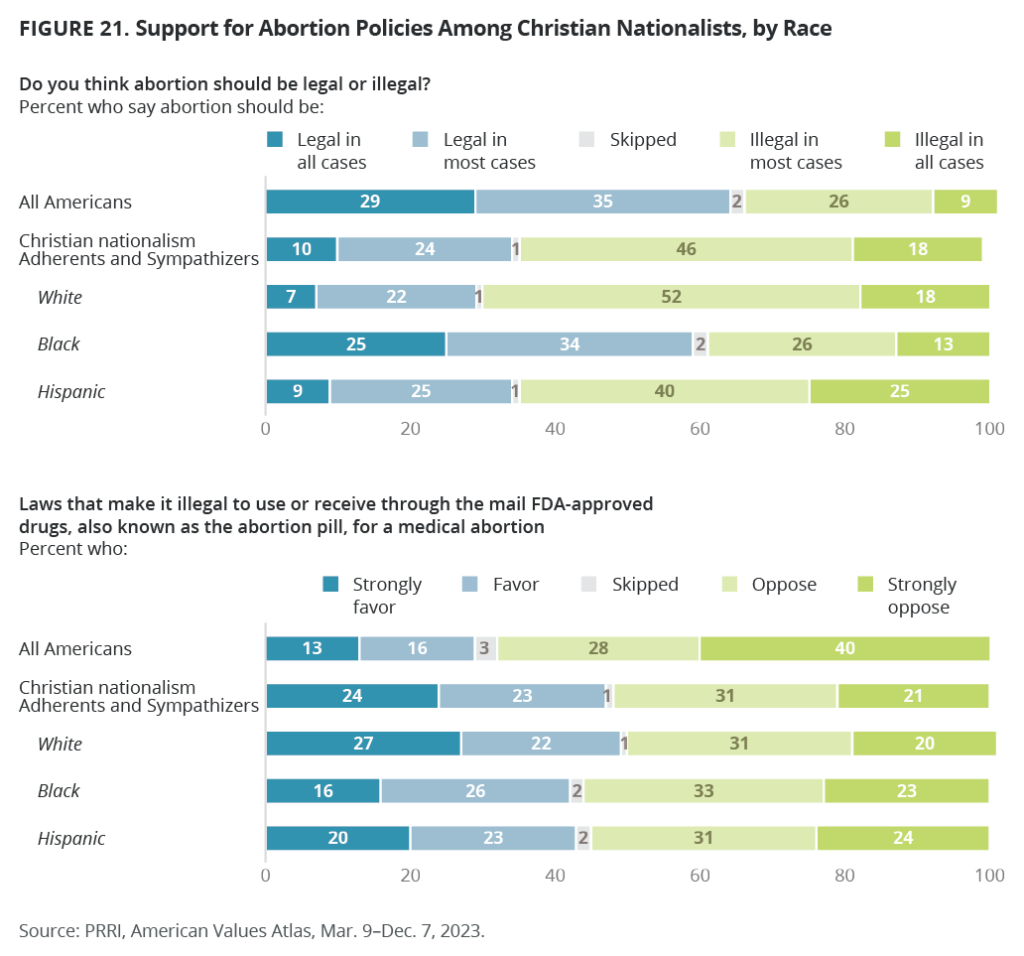
Support for Abortion Legality and Opposition to Abortion Pill
Christian nationalism Rejecters (93%) nearly unanimously support the legality of abortion in all or most cases, as do two-thirds of Christian nationalism Skeptics (67%). In comparison, 40% of Christian nationalism sympathizers and only one-quarter of Christian nationalism adherents (25%) say the same.
When examining Christian nationalism Adherents’ and Sympathizers’ views on abortion by racial groups, Black Christian nationalism Adherents and Sympathizers (59%) are about twice as likely as Hispanic Christian nationalism Adherents and Sympathizers (34%) and white Christian nationalism Adherents and Sympathizers (29%) to say abortion should be legal in all or most cases.
Although the difference is less stark than support for abortion legality, there is still a negative correlation between affinity for Christian nationalism and opposition to laws that would make it illegal to receive FDA-approved abortion drugs through the mail. Nearly nine in ten Christian nationalism Rejecters (87%) and 70% of Christian nationalism Skeptics oppose or strongly oppose making it illegal to receive abortion drugs through the mail. A slight majority of Christian nationalism Sympathizers (54%) oppose laws that would prevent people from receiving the abortion pill in the mail. Interestingly, Christian nationalism Adherents are split on their views of these laws, with 49% opposing prohibitions and 51% supporting them.
In contrast to support for legality of abortion, when examining Christian nationalism Adherents’ and Sympathizers’ opposition to laws making it illegal to receive FDA-approved abortion drugs through the mail by racial groups, Black Christian nationalism Adherents and Sympathizers (56%) and Hispanic Christian nationalism Adherents and Sympathizers (55%) are less likely to oppose these laws than white Christian nationalism Adherents and Sympathizers (51%).
The Relationship Between Christian Nationalism and Support for Abortion Legality, by State
In the scatterplot below, the downward-sloping trend line through the distribution shows that, overall, the higher a state’s residents scored on the Christian nationalism scale, the less likely they are to support legal abortion. Mississippi has an average score of 0.48 on the Christian nationalism scale, and 50% of its residents support legal abortion in all or most cases. Similarly, Alabama has an average score of 0.48 on the Christian nationalism scale, and 54% of its residents support legal abortion in all or most cases. At the other end of the scale, Washington and Oregon both score an average of 0.22 on the Christian nationalism scale, and 73% and 72% of their residents, respectively, support legal abortion.
However, the states with the lowest and highest average scores on the Christian nationalism scale are not the states with the lowest and highest resident support for legal abortion. For example, Hawaii scores an average of 0.29 on the Christian nationalism scale and has the highest percentage of residents who support legal abortion (79%). Conversely, Utah and Idaho score an average of 0.35 and 0.39, respectively, on the Christian nationalism scale, and yet both states have the lowest resident support for legal abortion (45%).[6]
[1] See Appendix A for full red, blue, and battleground state classifications.
[2] Numbers for Jehovah’s Witnesses Witnesses, Muslims, Buddhists, and Unitarian Universalists are too small to report.
[3] Restriction groups were determined based on state classifications from the following sources:
nytimes.com/interactive/2022/us/abortion-laws-roe-v-wade.html
states.guttmacher.org/policies/abortion-policies
[4] After this survey was fielded, an April 2024 Arizona Supreme Court decision reinstated a law banning abortion at all points of pregnancy with very few exceptions.
[5] For full details of how the scale and groups were created, please see the PRRI survey report Support for Christian Nationalism in All 50 States: Findings from PRRI’s 2023 American Values Atlas.
[6] Because the question asking views on laws that make it illegal to use or receive through the mail FDA-approved drugs for medical abortion, often called abortion pills was asked only in waves 1 and 3, there are unfortunately not enough cases to report these views by state.
APPENDIX A. Support for Abortion Legality, Coded by Red, Blue, and Battleground States in the 2024 Election
The following table is sorted in descending order by the share of residents in each state who say abortion should be legal in most or all cases. Additionally, rows are coded red for safe Republican states, blue for safe Democratic states, and tan for battleground states.
Survey Methodology
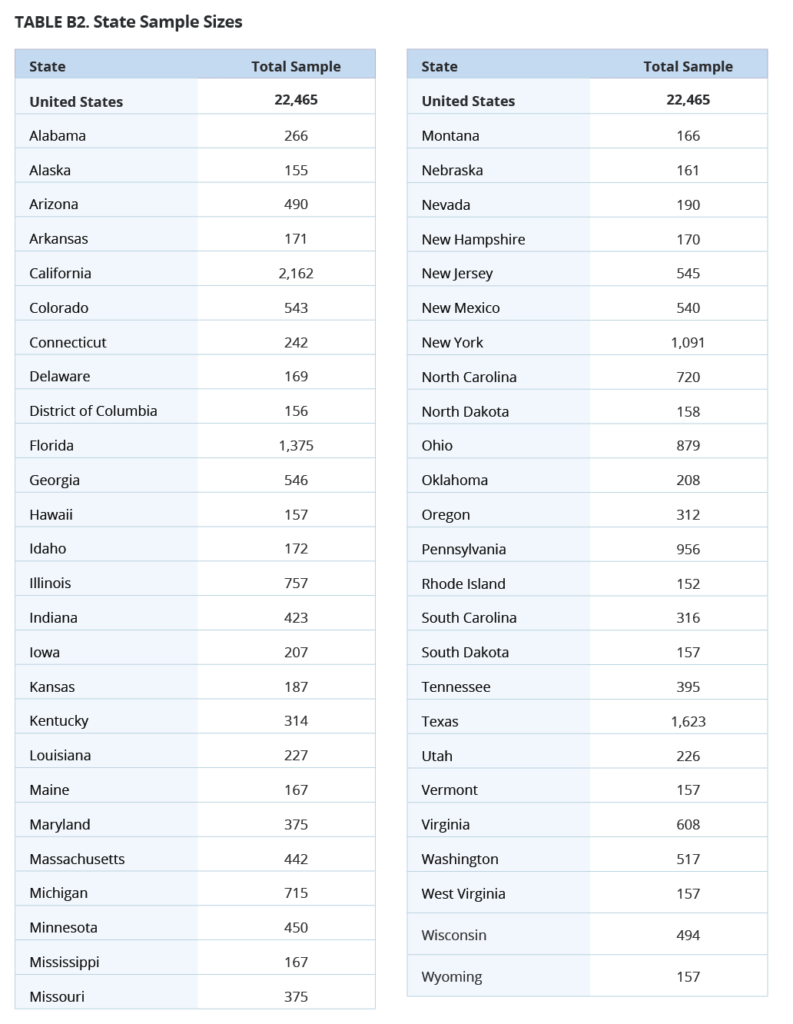
The survey was designed and conducted by PRRI. The survey was made possible through the generous support of Michelle Mercer and Bruce Golden. The survey was carried out among a random representative sample of 22,465 adults (age 18 and up) living in all 50 states in the United States. Among those, 20,799 are part of Ipsos’s KnowledgePanel and an additional 1,666 were recruited by Ipsos using opt-in survey panels to increase the sample sizes in smaller states. Interviews were conducted online between March 9 and December 7, 2023.
Respondents are recruited to the KnowledgePanel using an addressed-based sampling methodology from the Delivery Sequence File of the USPS – a database with full coverage of all delivery addresses in the U.S. As such, it covers all households regardless of their phone status, providing a representative online sample. Unlike opt-in panels, households are not permitted to “self-select” into the panel; and are generally limited to how many surveys they can take within a given time period.
The initial sample drawn from the KnowledgePanel was adjusted using pre-stratification weights so that it approximates the adult U.S. population defined by the 2022 March Supplement of the Current Population Survey (CPS), except language proficiency, which is not available from CPS, were obtained from the 2021 American Community Survey (ACS). Next, a probability proportional to size (PPS) sampling scheme was used to select a representative sample.
To reduce the effects of any non-response bias, a post-stratification adjustment was applied based on demographic distributions from the CPS. The post-stratification weight rebalanced the sample based on the following benchmarks: age, race and ethnicity, gender, Census division, metro area, education, and income. The sample weighting was accomplished using an iterative proportional fitting (IFP) process that simultaneously balances the distributions of all variables. Weights were trimmed to prevent individual interviews from having too much influence on the final results. In addition to an overall national weight, separate weights were computed for each state to ensure that the demographic characteristics of the sample closely approximate the demographic characteristics of the target populations. The state-level post-stratification weights rebalanced the sample based on the following benchmarks: age, race and ethnicity, gender, education, and income.
These weights from the KnowledgePanel cases were then used as the benchmarks for the additional opt-in sample in a process called “calibration.” This calibration process is used to correct for inherent biases associated with nonprobability opt-in panels. The calibration methodology aims to realign respondents from nonprobability samples with respect to a multidimensional set of measures to improve their representation.
The margin of error for the national survey is +/- 0.82 percentage points at the 95% level of confidence, including the design effect for the survey of 1.56. In addition to sampling error, surveys may also be subject to error or bias due to question wording, context, and order effects. Additional details about the KnowledgePanel can be found on the Ipsos website: https://www.ipsos.com/en-us/solution/knowledgepanel