
- The national inventory of active listings increased by 26.6% over last year.
- The total inventory of unsold homes, including pending listings, increased by just 1.3% year-over-year due to a decline in pending inventory (-21.9%).
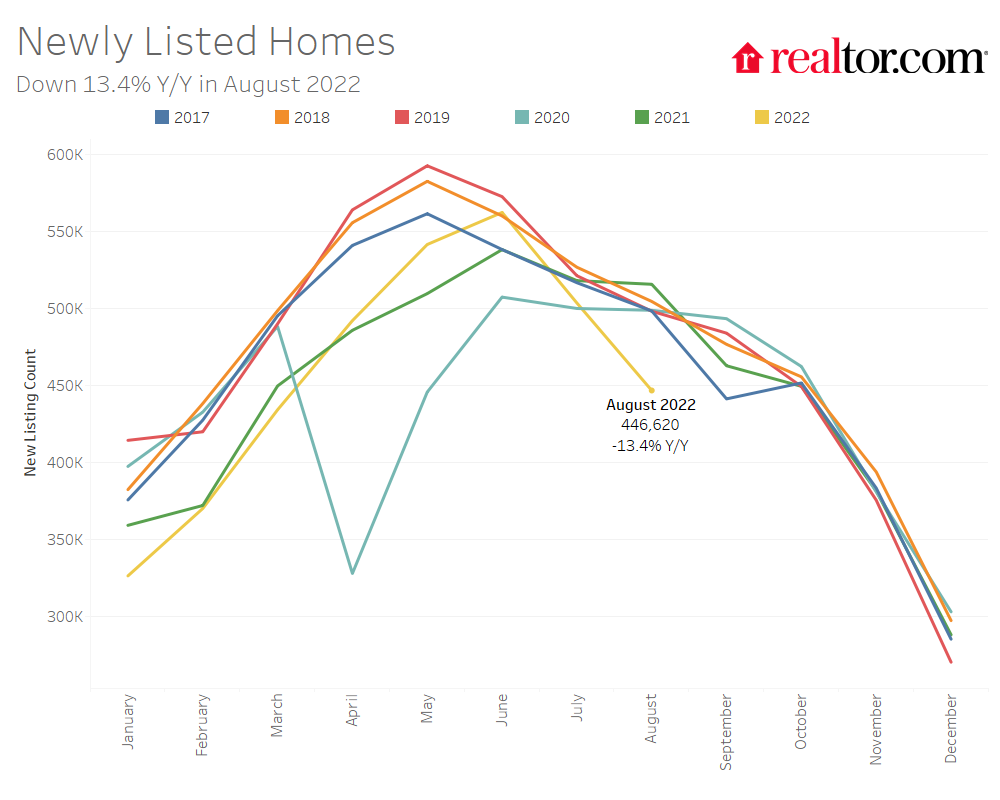
- Selling sentiment declined and listing activity followed, with newly listed homes declining by 13.4% on a year-over-year basis.
- The median list price grew by 14.3% in August, a deceleration from recent highs.
- Time on market was 42 days, 5 days more than last year but 22 days less than typical pre-pandemic levels.
- Regionally, large Western markets which saw some of the most growth last year and earlier this year are now showing the greatest signs of deceleration, with larger inventory increases, more price reductions, and more quickly decelerating price growth than other regions.
Realtor.com®’s August housing data release reveals that listing prices decelerated for the third month in a row, as more sellers hit pause on listing homes and homes for sale spent more time on the market than last August. While fewer new listings are entering the market, overall inventory continues to grow, providing more choice to buyers who are still shopping for a home. Western markets lead other regions in increased inventory, price reductions, and deceleration of price growth. This fall, a more moderate pace of homeselling, more listings to choose from, and softening price growth will provide some breathing room for buyers searching for a home during what is typically the best time to buy a home.
Selling Sentiment Wanes but the Inventory of Homes is Still Rising
Nationally, the inventory of homes actively for sale on a typical day in August increased by 26.6% over the past year. This amounted to 164,000 more homes actively for sale on a typical day in August compared to the previous year. However, driven by a decline in seller sentiment, the inventory growth rate in August was lower than July’s historical growth rate of 30.7%, which was the largest increase in inventory in the data history.

Despite this improvement in the number of homes actively for sale, as the chart above clearly illustrates, active listings lag their pre-pandemic level and are also still slightly lower than during the first year of the pandemic. The number of active listings in August was 7.2% below 2020 and 43.8% lower than the pre-pandemic 2017-2019 average.
The total number of unsold homes nationwide—a metric that includes active listings and listings in various stages of the selling process that are not yet sold—was up 1.3% year-over-year. However, growth decelerated from last month’s 3.5% growth rate as the count of pending listings and newly listed homes fell further on a year-over-year basis.
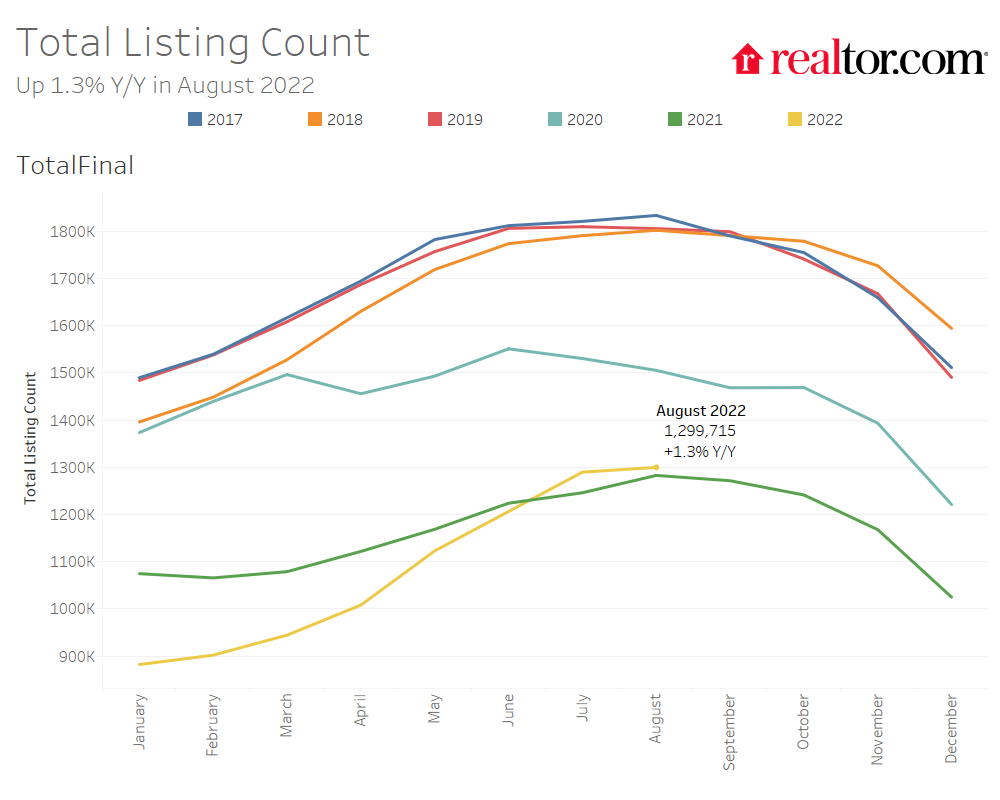
The total inventory of homes for sale includes homes in pending status, which are those listings in various stages of the selling process that are not yet sold. The inventory of pending listings on a typical day has declined by 21.9% compared to last August. This is a further deceleration from the 19.4% annual decline we reported for July. This moderating buyer demand has been spurred by rising interest rates and listing prices close to all-time highs that have increased the cost of financing 80% of the typical home by 61% compared to a year ago.

In August, newly listed homes declined by 13.4% compared to the same time last year, a greater rate of decline compared to last month’s 2.8% year-over-year decrease. While sellers had been fueling the recent run of inventory growth with freshly listed homes, in July, seller sentiment shifted greatly. Fannie Mae’s Home Purchase Sentiment Index (HPSI) revealed that home sentiment declined in July, as the net share of respondents saying now is a good time to sell decreased by 2 percentage points compared to the previous month and by 15 percentage points compared to last year. Sellers may feel that they have missed the peak, or that it’s too difficult and expensive to buy another home at this time given the costs of financing, a concern that could affect nearly three-quarters of potential sellers per recent survey data. The HPSI survey also revealed that the net share of Americans who believe home prices will go up over the next 12 months decreased by 8 percentage points in July compared to the previous month.
The inventory of homes actively for sale in the 50 largest U.S. metros overall increased by 39.1% over last year in August, outpacing the national growth rate. However, the inventory of homes in large Northeastern metros declined by 2.4% on average compared to last year, while other regions saw growth in the number of homes for sale. In the West, active listings grew most (by +70.8% year-over-year), followed by the South (+56.3%), and Midwest (+6.5%). No regions saw new listing activity above the previous year. The South saw newly listed homes decline by 3.8% compared to the previous year, while they declined by 19.7% in the Northeast, 18.1% in the Midwest, and 14.3% in the West.
Inventory increased in 39 out of 50 of the largest metros compared to last year. Metros which saw the most inventory growth include Phoenix (+177.4%), Raleigh (+163.6%), and Austin (+138.6%), all of which experienced booming demand during the pandemic. Inventory is still declining on a year-over-year basis in 11 markets including Hartford (-24.4%), Milwaukee (-11.8%), and Chicago (-11.7%). Milwaukee and Chicago also made our list of most improved large markets in our Market Hotness Rankings.
Only 8 of the 50 largest metros also saw the number of newly listed homes increase compared to last year, down from 12 in July. The markets which saw the highest year-over-year growth in newly listed homes included Nashville (+25.5%), Raleigh (+14.4%) and Las Vegas (+13.1%). Markets which are seeing large declines in newly listed homes compared to last year include San Jose (-29.3%), Baltimore (-28.3%), and Washington, DC (-27.0%).
Time on Market Grows for the First time Since 2020
The typical home spent 42 days on the market this August which is five days more than last year and the first month that time on market increased since June 2020, during the early days of the pandemic. While new listing activity has declined, the inventory of homes for sale continues to increase as homes spend slightly longer on the market compared to last year. Nonetheless, homes still spent 22 fewer days on the market this August than typical 2017 to 2019 timing.
In the 50 largest U.S. metros, the typical home spent 37 days on the market, five days more than last August. Time on market increased similarly across regions, with larger metros in the West seeing the greatest increase (+7 days), followed by the South and Midwest (+4 days) and the Northeast (+3 days).
Forty-eight of the 50 largest metros saw time on market increase compared to the previous year. Time on market only declined in Miami, by 9 days compared to last year, and in Richmond, by 1 day. Time on market increased most in the southern and western metros of Austin (+16 days), Raleigh (+12 days), and Riverside (+11 days).

Price Growth Softens but Homes Are Still More Expensive than Last Year
The median national home price for active listings declined to $435,000 in August, down from an all-time high of $450,000 in June. This represents an annual growth rate of 14.3%, a deceleration from last month’s growth rate of 16.6%. In addition, the 3.1% drop in the median listing price compared to July is also the largest July-to-August drop in the median listing price in our records (dating back to 2016).
Until recently, the median listing price has been buoyed by slow adjustments to seller expectations as well as a shift in the mix of inventory which saw 57% of active listings comprise of larger (1750 sqft+) homes compared to just 54% last August. However, controlling for home size, the median listing price per square foot grew by 13.2% year-over-year, down from a growth rate of 15.5% in July, further signaling a moderation in price growth ahead.
In addition, the median list price of listings in pending status–those homes for which the seller has already accepted a buyer’s offer to purchase–also decelerated, from a year-over-year rate of 12.4% in July to a growth rate of 11.9% in August. This is the fourth consecutive month of pending listing price deceleration and its lower growth rate compared to the overall median listing price indicates that the homes which buyers are choosing to buy are becoming increasingly less expensive than the typical listed home.

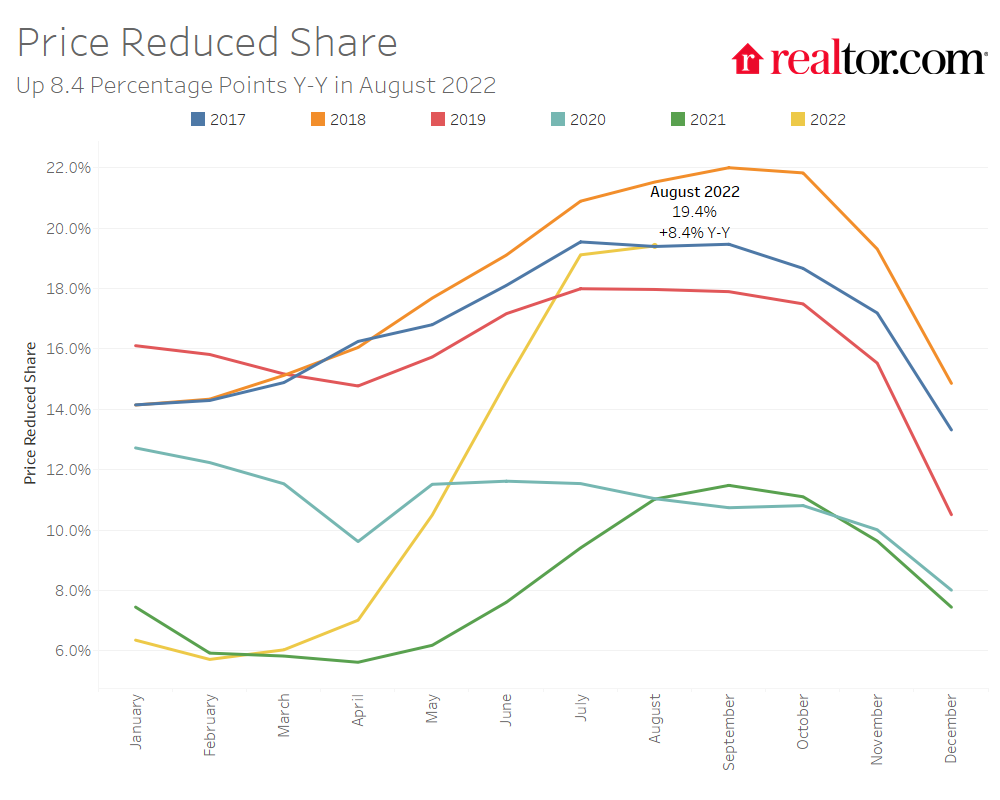
The share of homes having their price reduced increased from 11.0% last August to 19.4% this year and is close to typical 2017 to 2019 levels. While price reductions have increased significantly compared to last year, as a share of inventory they were above August 2019 (17.9% of inventory) and still slightly below 2018 (21.3%) and 2017 (19.5%).
Active listing prices in the nation’s largest metros grew by an average of 10.9% compared to last year, decelerating from 12.0% last month. Southern metros led the charge in active listing price growth, growing by 13.5% on average over the past year. The southern metros of Miami (+33.4%), Memphis (+25.8%), posted the highest year-over-year median list price growth in August, followed by Milwaukee (+25.0%). Milwaukee also ranked as the most improved large market in our Market Hotness Rankings. Large western metros, while not the lowest ranking for price growth, have seen the greatest price deceleration since this spring. Western metros had the largest average growth rate of 16.6% in April, and have since fallen to tie the Northeast for third place among regions with a growth rate of 7.9%. Large western metros also saw the greatest increase in the share of price reductions (+16.2 percentage points), followed by southern metros (+10.4 percentage points). No western metros made our list of hottest markets in August, the first time this has happened in August in our data’s history. Homes in Phoenix (+30.9 percentage points), Austin (+24.8 percentage points), and Las Vegas (+24.4 percentage points) showed the greatest growth in the share of homes with price reductions compared to last year.
August 2022 Regional Statistics (50 Largest Metro Combined Average)
| Region | Active Listing Count YoY | New Listing Count YoY | Median Listing Price YoY | Median Listing Price Per SF YoY | Median Days on Market Y-Y (Days) | Price Reduced Share Y-Y (Percentage Points) |
| Midwest | 6.5% | -18.1% | 11.3% | 8.6% | + 4 days | +4.2 pp |
| Northeast | -2.4% | -19.7% | 7.9% | 4.4% | +3 days | +2.7 pp |
| South | 56.3% | -3.8% | 13.5% | 12.0% | +4 days | +10.4 pp |
| West | 70.8% | -14.3% | 7.9% | 7.7% | +7 days | +16.2 pp |
August 2022 Housing Overview by Top 50 Largest Metros
| Metro | Median Listing Price | Median Listing Price YoY | Median Listing Price per Sq. Ft. YoY | Active Listing Count YoY | New Listing Count YoY | Median Days on Market | Median Days on Market Y-Y (Days) | Price Reduced Share | Price Reduced Share Y-Y (Percentage Points) |
| Atlanta-Sandy Springs-Roswell, Ga. | $425,000 | 7.3% | 9.0% | 48.7% | -5.8% | 35 | 1 | 22.0% | 12.8 pp |
| Austin-Round Rock, Texas | $575,000 | 6.0% | 7.5% | 138.6% | -2.0% | 39 | 16 | 41.5% | 24.8 pp |
| Baltimore-Columbia-Towson, Md. | $352,000 | 5.2% | 4.6% | -3.2% | -28.3% | 37 | 3 | 16.7% | 3.7 pp |
| Birmingham-Hoover, Ala. | $284,000 | 4.2% | 10.3% | 27.3% | -11.2% | 42 | 5 | 17.2% | 9.2 pp |
| Boston-Cambridge-Newton, Mass.-N.H. | $729,000 | 12.2% | 4.2% | 4.5% | -22.4% | 35 | 4 | 17.1% | 4.6 pp |
| Buffalo-Cheektowaga-Niagara Falls, N.Y. | $247,000 | 6.6% | 6.7% | 11.2% | -13.1% | 37 | 6 | 9.3% | 1.9 pp |
| Charlotte-Concord-Gastonia, N.C.-S.C. | $425,000 | 10.3% | 12.6% | 64.3% | 11.4% | 37 | 9 | 19.9% | 7.6 pp |
| Chicago-Naperville-Elgin, Ill.-Ind.-Wis. | $350,000 | 2.6% | 1.9% | -11.7% | -24.4% | 36 | 1 | 15.4% | 2.2 pp |
| Cincinnati, Ohio-Ky.-Ind. | $325,000 | 1.6% | 5.8% | -7.0% | -21.4% | 34 | 3 | 13.8% | 3.2 pp |
| Cleveland-Elyria, Ohio | $225,000 | 12.5% | 8.7% | 4.9% | -14.1% | 41 | 2 | 16.6% | 3.5 pp |
| Columbus, Ohio | $336,000 | 12.0% | 11.0% | 11.1% | -15.2% | 29 | 8 | 19.4% | 6.2 pp |
| Dallas-Fort Worth-Arlington, Texas | $461,000 | 16.7% | 13.6% | 80.7% | 5.4% | 36 | 5 | 26.3% | 14 pp |
| Denver-Aurora-Lakewood, Colo. | $637,000 | 6.2% | 2.1% | 71.6% | -13.4% | 30 | 9 | 31.3% | 18.7 pp |
| Detroit-Warren-Dearborn, Mich. | $275,000 | 2.6% | 3.4% | 25.5% | -10.0% | 33 | 9 | 24.3% | 7.3 pp |
| Hartford-West Hartford-East Hartford, Conn. | $377,000 | 14.2% | 3.9% | -24.4% | -24.1% | 37 | 4 | 9.4% | 0.4 pp |
| Houston-The Woodlands-Sugar Land, Texas | $383,000 | 5.3% | 8.2% | 23.2% | -1.4% | 38 | 1 | 21.4% | 7.3 pp |
| Indianapolis-Carmel-Anderson, Ind. | $313,000 | 12.0% | 12.6% | 39.6% | -9.3% | 37 | 1 | 20.5% | 9 pp |
| Jacksonville, Fla. | $429,000 | 19.5% | 17.7% | 75.1% | -4.7% | 41 | 3 | 23.2% | 13.1 pp |
| Kansas City, Mo.-Kan. | $387,000 | 20.2% | 13.5% | 29.5% | -17.1% | 46 | 7 | 14.3% | 4.2 pp |
| Las Vegas-Henderson-Paradise, Nev. | $470,000 | 11.3% | 15.1% | 93.4% | 13.1% | 37 | 11 | 41.3% | 24.4 pp |
| Los Angeles-Long Beach-Anaheim, Calif. | $938,000 | 4.3% | 5.1% | 37.9% | -17.5% | 37 | 4 | 19.4% | 10.9 pp |
| Louisville/Jefferson County, Ky.-Ind. | $299,000 | 12.9% | 7.9% | 15.5% | -17.8% | 32 | 6 | 19.8% | 6.2 pp |
| Memphis, Tenn.-Miss.-Ark. | $313,000 | 25.8% | 22.2% | 55.5% | -7.4% | 39 | 2 | 16.4% | 9.3 pp |
| Miami-Fort Lauderdale-West Palm Beach, Fla. | $617,000 | 33.4% | 18.9% | 8.6% | -6.1% | 50 | -9 | 14.8% | 7.4 pp |
| Milwaukee-Waukesha-West Allis, Wis. | $362,000 | 25.0% | 13.3% | -11.8% | -26.9% | 36 | 1 | 13.8% | -1.1 pp |
| Minneapolis-St. Paul-Bloomington, Minn.-Wis. | $420,000 | 18.3% | 8.4% | -5.1% | -22.7% | 37 | 8 | 16.8% | 5.8 pp |
| Nashville-Davidson–Murfreesboro–Franklin, Tenn. | $533,000 | 21.2% | 13.1% | 129.2% | 25.5% | 28 | 10 | 27.4% | 15.7 pp |
| New Orleans-Metairie, La. | $334,000 | -1.8% | 1.5% | 24.4% | -14.8% | 49 | 4 | 22.9% | 9.3 pp |
| New York-Newark-Jersey City, N.Y.-N.J.-Pa. | $637,000 | 6.3% | 3.1% | -9.4% | -20.4% | 54 | 2 | 10.3% | 1.4 pp |
| Oklahoma City, Okla. | $320,000 | 14.1% | 16.1% | 40.7% | 8.7% | 41 | 5 | 18.6% | 6.3 pp |
| Orlando-Kissimmee-Sanford, Fla. | $454,000 | 21.1% | 19.3% | 74.0% | -3.1% | 40 | 3 | 22.0% | 11.4 pp |
| Philadelphia-Camden-Wilmington, Pa.-N.J.-Del.-Md. | $339,000 | 6.1% | 7.1% | -1.8% | -22.2% | 46 | 3 | 14.5% | 2.9 pp |
| Phoenix-Mesa-Scottsdale, Ariz. | $500,000 | 5.3% | 11.2% | 177.4% | -6.4% | 38 | 8 | 42.7% | 30.9 pp |
| Pittsburgh, Pa. | $236,000 | 1.4% | 0.5% | 1.5% | -17.3% | 44 | 2 | 19.0% | 4.7 pp |
| Portland-Vancouver-Hillsboro, Ore.-Wash. | $595,000 | 7.1% | 6.6% | 51.3% | -18.2% | 37 | 3 | 29.0% | 13 pp |
| Providence-Warwick, R.I.-Mass. | $475,000 | 10.9% | 8.5% | 0.3% | -20.5% | 33 | 2 | 12.0% | 3.8 pp |
| Raleigh, N.C. | $487,000 | 15.2% | 12.6% | 163.6% | 14.4% | 30 | 12 | 23.9% | 16.7 pp |
| Richmond, Va. | $385,000 | 10.0% | 9.3% | 2.7% | -22.9% | 37 | -1 | 11.3% | 3.6 pp |
| Riverside-San Bernardino-Ontario, Calif. | $587,000 | 8.2% | 10.6% | 75.6% | -16.0% | 42 | 11 | 23.4% | 14.7 pp |
| Rochester, N.Y. | $225,000 | -1.7% | 5.2% | -4.6% | -12.8% | 23 | 5 | 11.6% | 0.2 pp |
| Sacramento–Roseville–Arden-Arcade, Calif. | $615,000 | 4.4% | 5.1% | 63.0% | -14.2% | 36 | 8 | 29.7% | 17.3 pp |
| San Antonio-New Braunfels, Texas | $375,000 | 7.1% | 9.3% | 66.5% | 1.6% | 39 | 5 | 22.4% | 10.1 pp |
| San Diego-Carlsbad, Calif. | $897,000 | 9.5% | 10.5% | 45.8% | -20.3% | 32 | 4 | 23.6% | 13.8 pp |
| San Francisco-Oakland-Hayward, Calif. | $1,049,000 | 5.4% | 4.8% | 40.4% | -19.7% | 35 | 7 | 17.7% | 10 pp |
| San Jose-Sunnyvale-Santa Clara, Calif. | $1,372,000 | 9.7% | 5.4% | 31.1% | -29.3% | 36 | 6 | 18.4% | 11 pp |
| Seattle-Tacoma-Bellevue, Wash. | $777,000 | 15.1% | 8.7% | 91.4% | -14.8% | 34 | 5 | 21.9% | 13.6 pp |
| St. Louis, Mo.-Ill. | $279,000 | 11.8% | 8.9% | -2.2% | -15.6% | 44 | 3 | 14.6% | 3.6 pp |
| Tampa-St. Petersburg-Clearwater, Fla. | $437,000 | 21.6% | 15.5% | 101.0% | 0.4% | 37 | 3 | 27.8% | 16.8 pp |
| Virginia Beach-Norfolk-Newport News, Va.-N.C. | $359,000 | 15.6% | 10.4% | -10.3% | -18.3% | 29 | 3 | 17.1% | 3.4 pp |
| Washington-Arlington-Alexandria, DC-Va.-Md.-W. Va. | $573,000 | 13.2% | 2.9% | 1.5% | -27.0% | 36 | 3 | 17.5% | 4.8 pp |
Subscribe to our mailing list to receive updates and notifications on the latest data and research.