

July Highlights
- Median listed rent was $1,879 in the 50 largest US metropolitan areas, an increase of just $3 from June.
- Rent grew by 12.3% over July of 2021, the lowest year-over-year growth rate since August of last year.
- Rent is growing faster in urban areas (+12.8%) than in suburban ones (+11.7%), a reversal of the earlier pandemic-induced trend.
- Studio unit rents continue to grow at a faster rate than 1- and 2-bedroom unit rents, especially in urban areas of major cities.
- Realtor.com’s Avail survey finds that rising cost of housing is the leading cause of financial strain among renters, even more than the cost of food or transportation.
Rent Flattens and Year-over-Year Growth Continues to Slide
The median rent across the 50 largest metropolitan areas in the United States grew by just $3 from June 2022 into July, reaching $1,879. This sets yet another new high for national rent, breaking the record for the 17th month in a row, but it also signals a significant slowdown in rent growth. This was the smallest month-to-month growth in 2022 thus far, and the lowest year-over-year rent growth since August of last year. Rent is finally leveling off, with growth quickly sliding nearer to a sustainable equilibrium level as it has been since January. Despite the encouraging indicators, the challenges of record-high rent, 12.3% higher than last year, amid 8.5% inflation and just 5.2% wage growth are very real to renters. Relief in the form of moderating rent charges is coming, but it has not arrived yet.
Figure 1: Year-over-Year Rent Trend
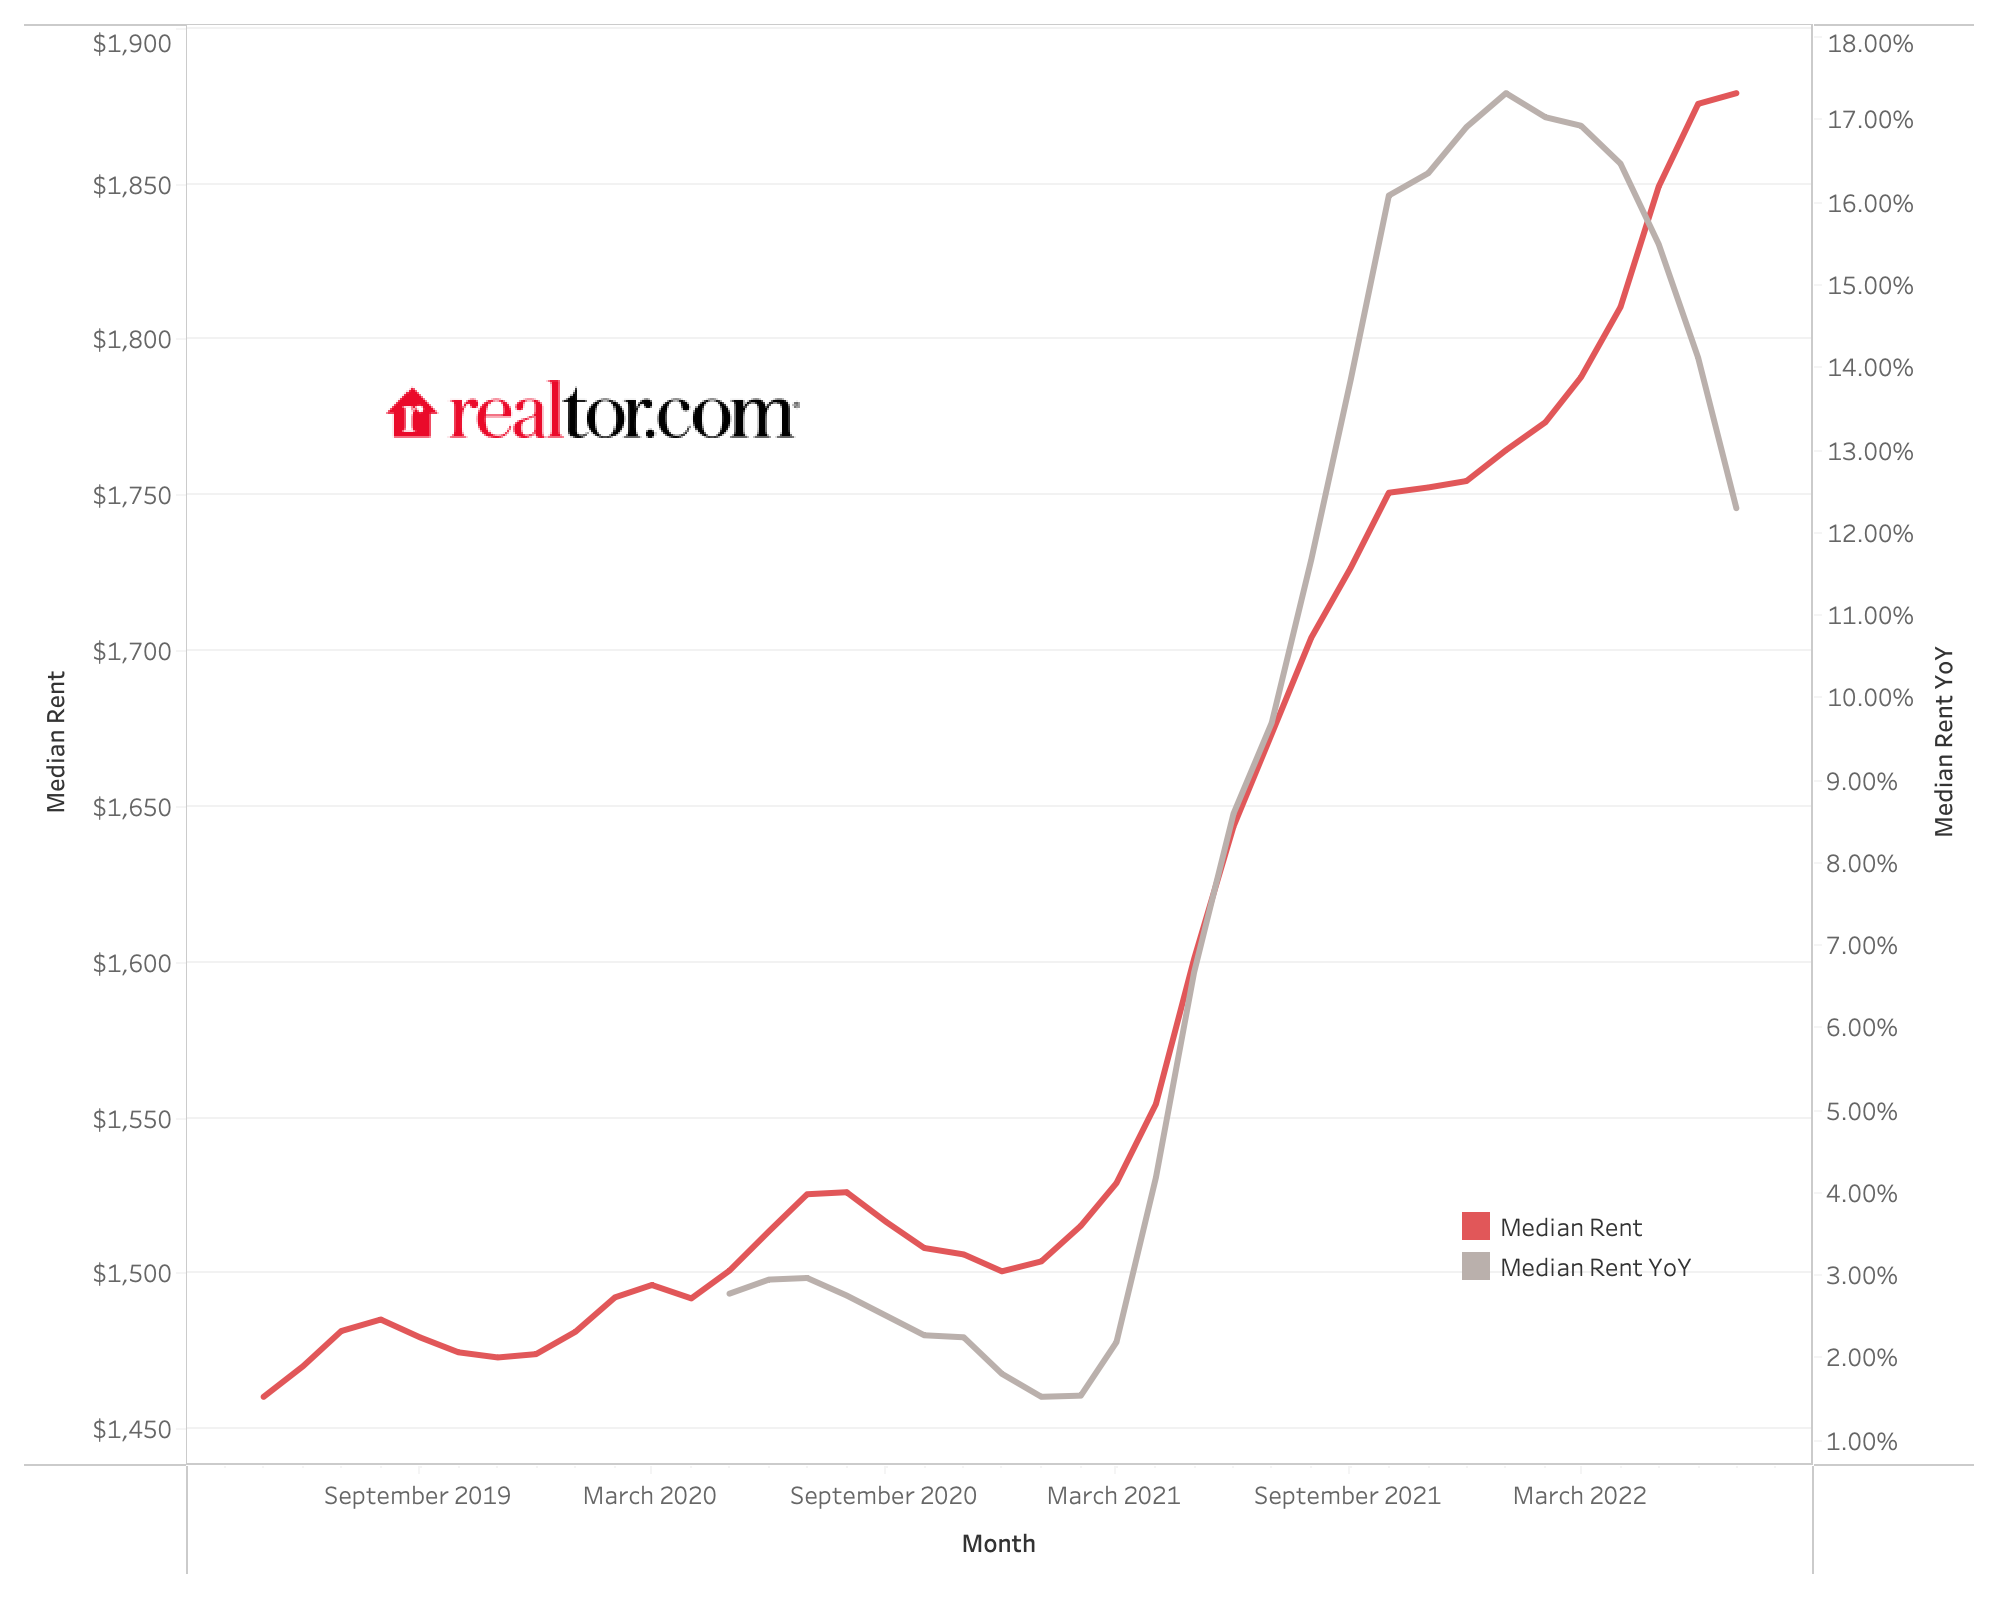
For the 10th consecutive month, Miami leads the way in terms of year-over-year rent growth. Growth in the red-hot rental market in South Florida peaked in April when rents were 51.6% higher than the year before, but has slowly slid to 26.2% in July. Miami’s lead has narrowed significantly. This month it just slightly edges out New York City (+25.4%) and Boston (+24.8%), where in April it had an 18.8 percentage point lead on second-place Orlando. The other fastest-growing rents for July 2022 are in Chicago (+20.6%) and Orlando (+20.4%). Rent is growing the slowest in Minneapolis (+3.3%), Sacramento (+3.4%), Riverside (4.2%), Phoenix (4.8%), and Buffalo (6.3%).
Similar to the nationwide pattern, in which low vacancy rates are driving home price and rent growth, the supply of available rental units in these markets correlates closely with increases in monthly rent. Among the five metros with the fastest growing rent, the rental vacancy rate decreased by an average of 1.2 percentage points from the second quarter of 2021 to the second quarter of 2022. The five metros with the slowest rent growth saw vacancy rates increase by an average of 0.4 percentage points over the same period. Some interesting outliers include Louisville, where the rental vacancy rate fell by a staggering 9.2 percentage points year-over-year and rent grew by just slightly more than the national average (+13.1%), and Raleigh, where the rental vacancy rate increased by 5.1 percentage points but rent outpaced the national average (+13.3%). This suggests that Raleigh rent growth may continue to cool with more units currently on the market, while Louisville could continue to see strong rent growth as more renters chase after fewer available units.
Urban Areas of Top-Growth Metros Drive Increased Rents
In four of the five markets above where rent is growing the fastest year-over-year, rents for units located in urban areas are growing faster than rents in suburban parts of the metros. In the fifth, Orlando, urban and suburban areas are seeing rent growth increase at about the same pace. The uptick in city-center rents is most pronounced in New York, where urban rents increased 38.3% from July 2021, 25.4 percentage points faster than in the suburbs, which also had a stronger-than-average growth rate of 12.9%. Chicago (+27.1% in urban areas and +11.4% in suburban areas) and Boston (+30.6% urban and +19.1% suburban) saw similar splits between relatively strong rent growth in the suburbs and a blistering pace of rent growth in the city centers. Big cities are getting back to in-person work; bars, restaurants, and event venues are back in full swing; and the mid-pandemic focus on renting in the suburbs to take advantage of remote work is beginning to subside as the social appeal of big-city life is coming into focus again.
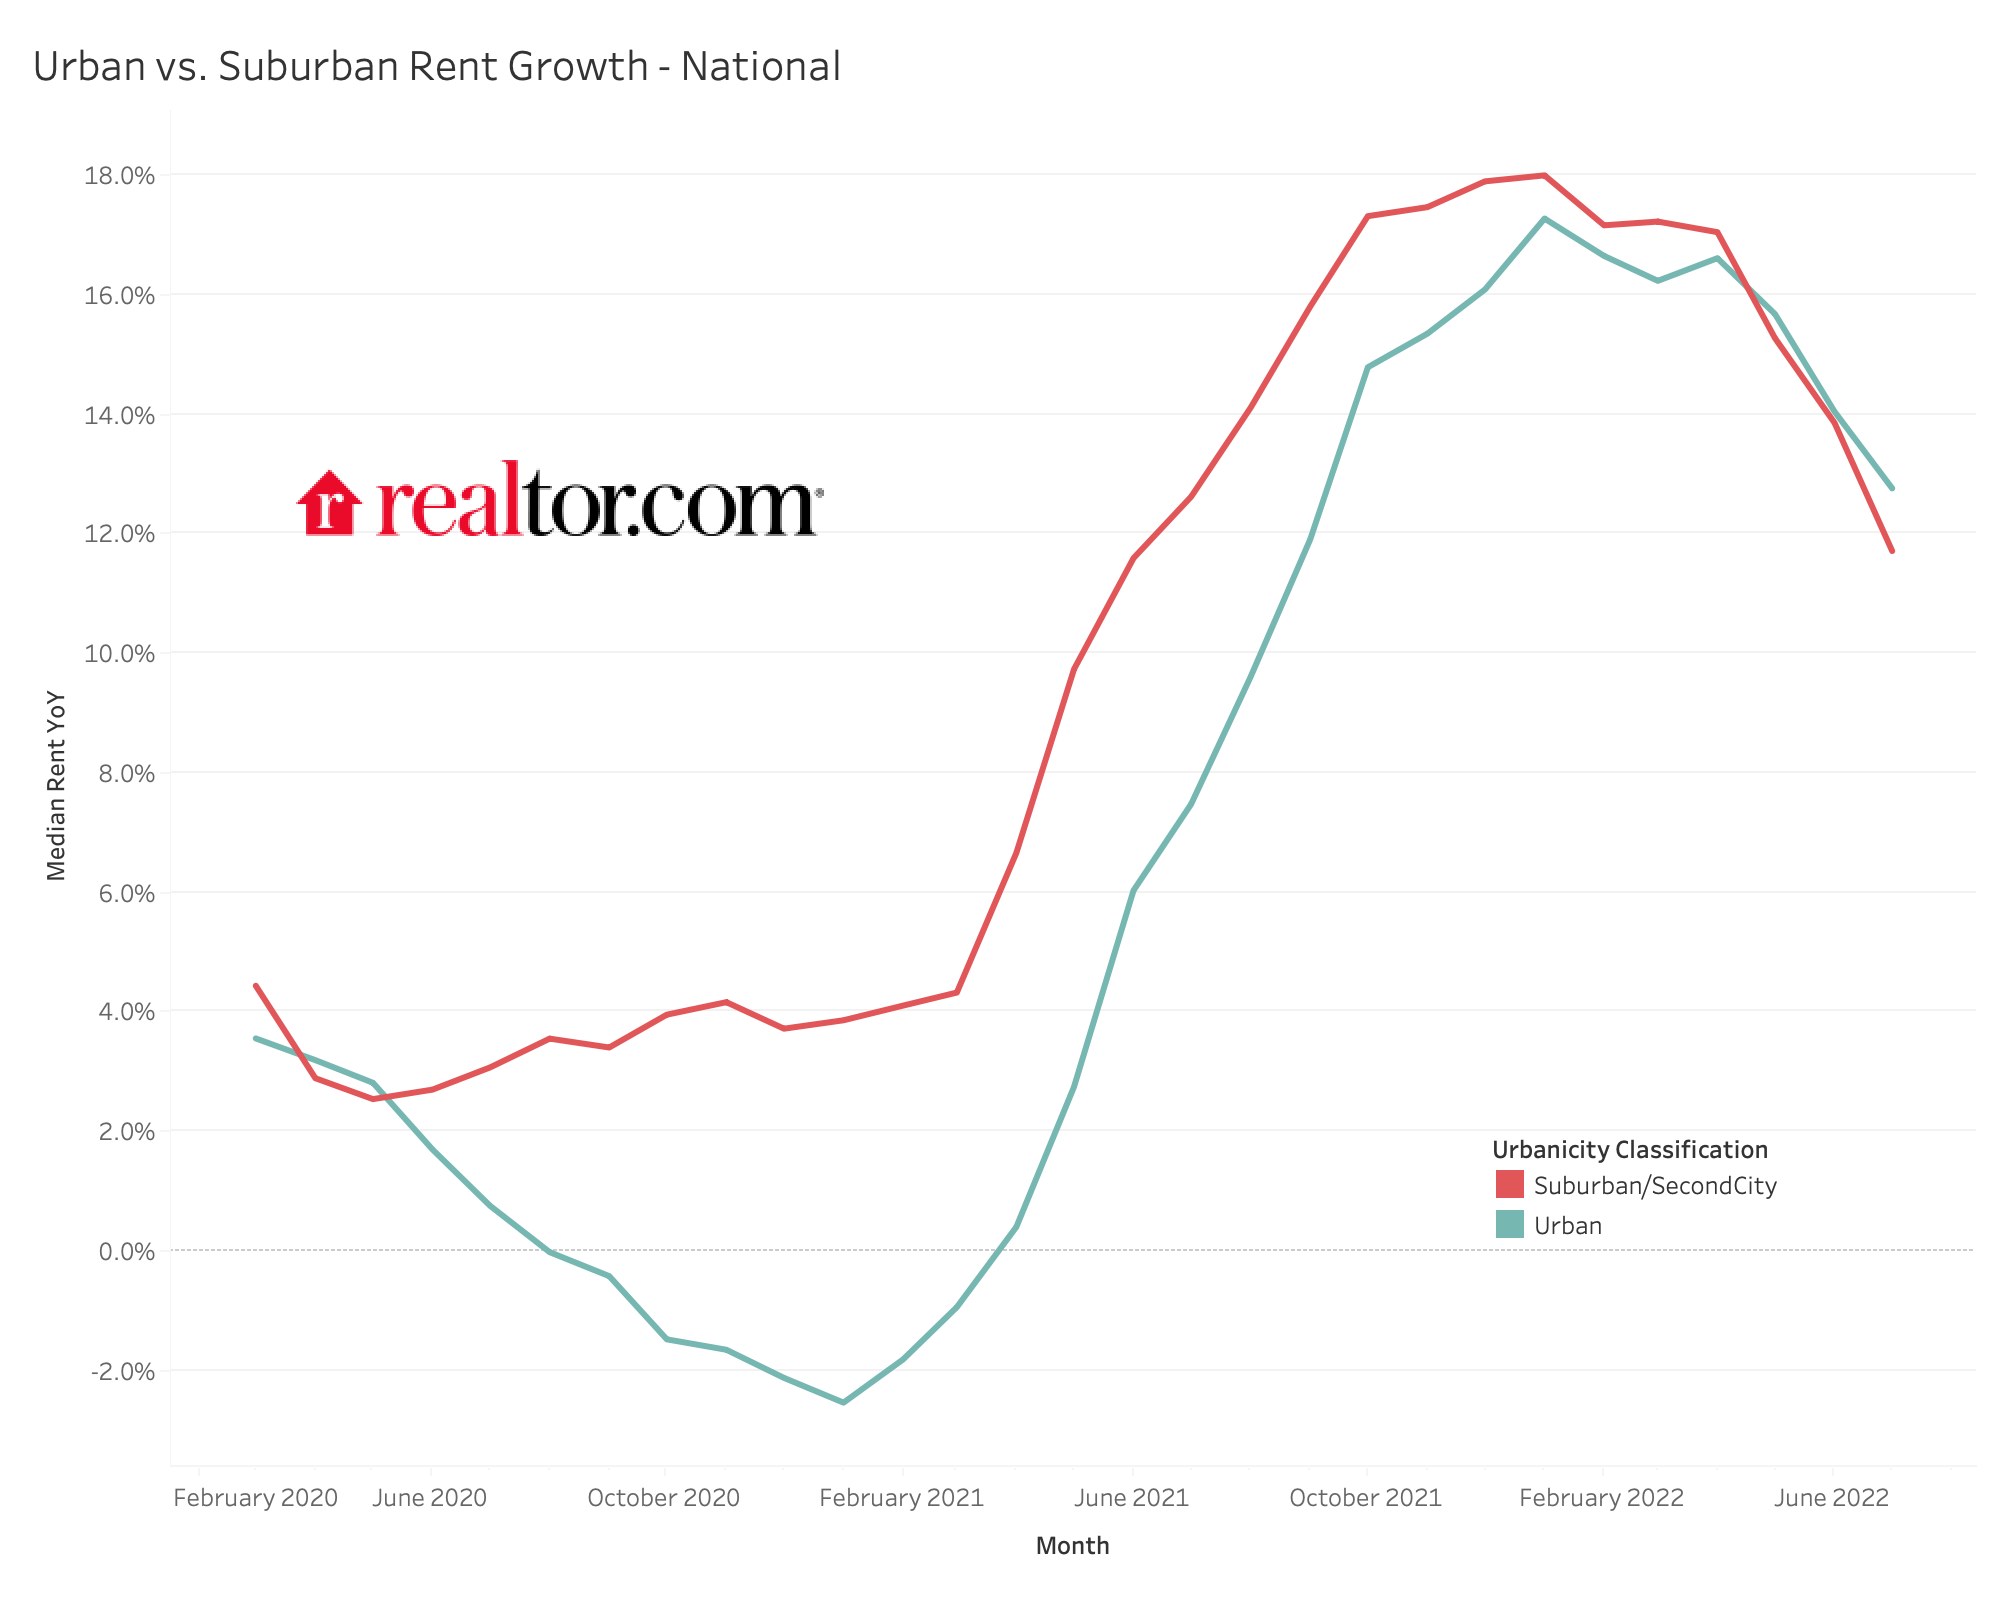
The nationwide breakdown of urban and suburban rent growth shows this pattern as well. In early 2020, suburban and urban rents were both growing around 3% year-over-year. By January 2021, urban rent was falling by 2.5% while suburban rent was growing by 3.9% as renters had been fleeing the city during the peak of the pandemic. Since then, that gap shrank and shrank until it finally converged in the second quarter of this year, and now in July, urban rent ($1,928) is growing at 12.8% compared to suburban rent ($1,821) at 11.7%.
Figure 2: Urban vs. Suburban Rent Growth – National
Though the gap between urban and suburban rent growth just opened up in July for the 50 largest metropolitan areas, city centers in the ten largest metros have seen faster-growing rents since April, and the difference this month was stark. Urban rent grew at 20.2% year-over-year in these ten cities compared to suburban rent at 13.6%. The preference for renting in the major metros is evident, as even the suburban pace among these ten exceeds the overall national average of 12.3% growth. Also worth noting is the fact that among the larger metros, the pre-pandemic suburban rent growth was stronger than the national average and the negative urban growth mid-pandemic was more severe. The return to big-city living has driven an especially strong resurgence in urban rents in the largest metro areas.
Figure 3: Urban vs. Suburban Rent Growth – 10 Largest Metros

On a longer time horizon, though, it is important to consider that renting in the suburbs is less affordable relative to renting the city than it was prior to the pandemic. In July of 2019, urban rent was 12.4% higher than suburban rent nationally, while that premium slipped to 4.9% in the peak of suburban rent growth in July 2021 and has just ticked back up to 5.8% this July.
Table 1: Urban vs. Suburban Rent
| July of Year | Urban Rent | Suburban Rent | Urban Premium |
| 2019 | $1,579 | $1,404 | 12.4% |
| 2020 | $1,590 | $1,447 | 9.9% |
| 2021 | $1,709 | $1,630 | 4.9% |
| 2022 | $1,928 | $1,821 | 5.8% |
Studio Rents Pick Up Growth Pace, Especially in Urban Centers
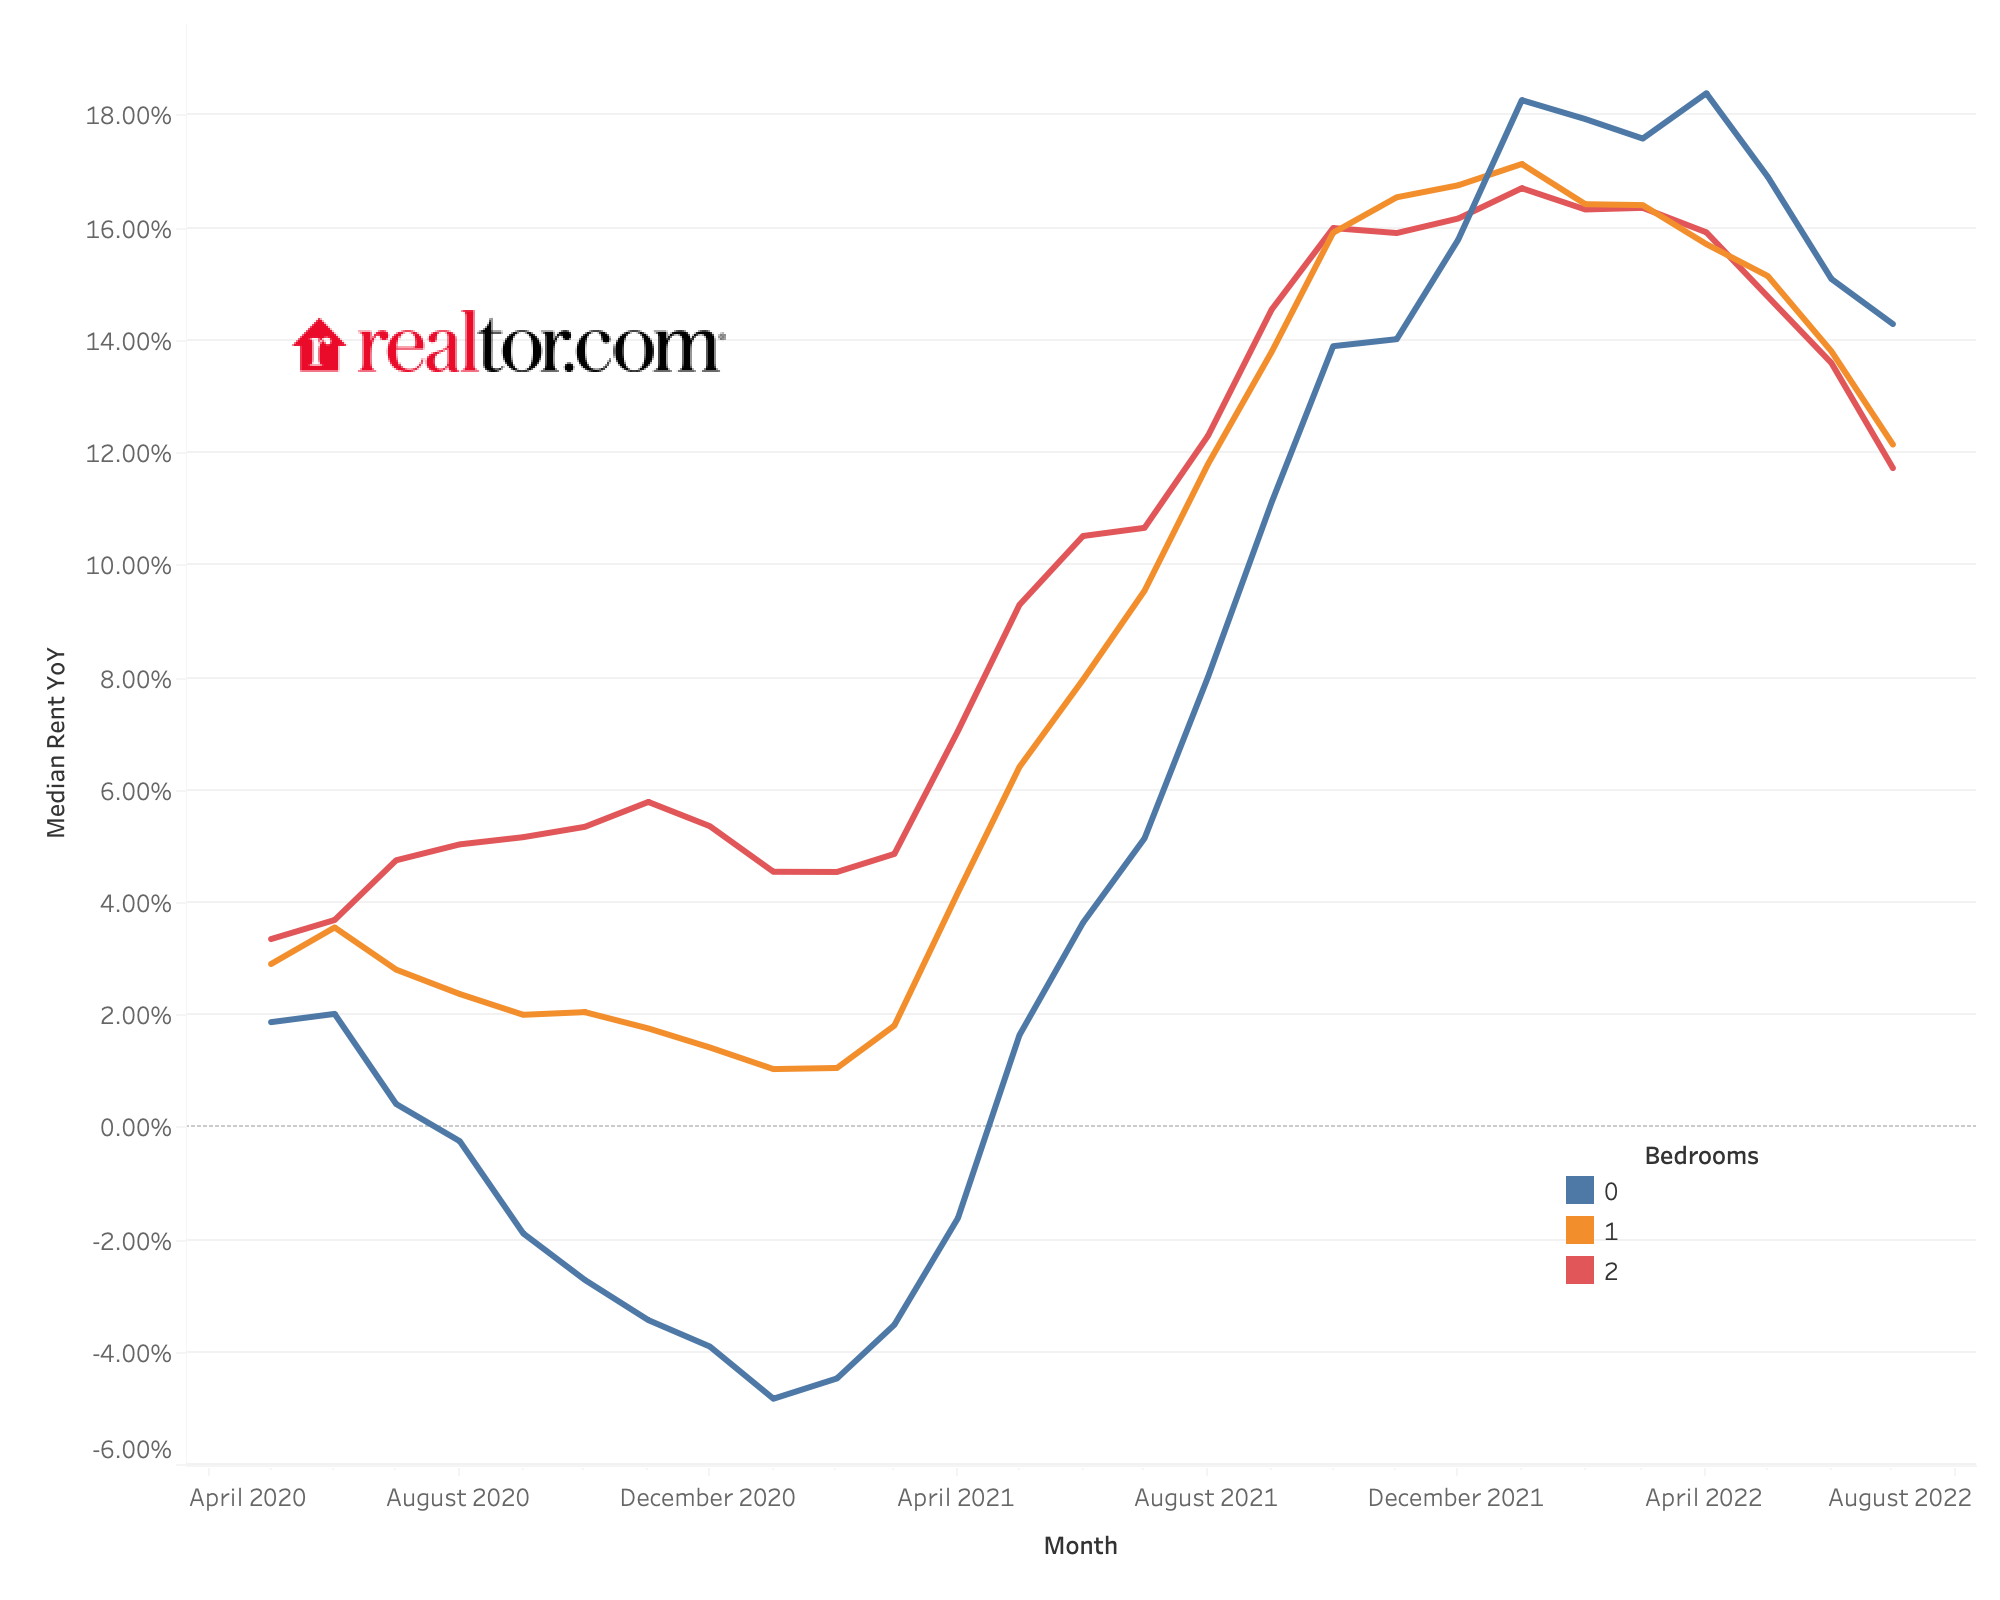
In each month of 2022 thus far, 0-bedroom (or studio) unit rents have been growing at a faster clip than rents for 1- and 2-bedroom units. Given the fact that studios are more heavily concentrated in urban areas and larger cities, this sustained growth is consistent with the trend of workers returning to cities and seeking out more affordable smaller units. As overall rents have grown at double-digit paces for 12 consecutive months now, the relative affordability of 0-bedroom units has become more attractive as well. Studio rent grew the fastest in Chicago, at 46.4% year-over-year, with Miami (+33.0%), Boston (+31.2%), and New York (+31.0%) close behind. These four fastest-growing cities in terms of rents overall each have studio rents growing the fastest of our rental size categories, and 30 of the 50 largest metros saw studio rent grow faster than rent for 0-2 bedroom rentals together. Notable exceptions to studio supremacy can be found in some of the smaller cities in the study. Birmingham and Sacramento actually had a median studio rent that was lower than last year, and Nashville studio rent grew at just 1.2% compared to 14.6% overall.
Table 2: National Rents by Unit Size
| Unit Size | Median Rent | Rent YoY | Rent Change – 2 years |
| Overall | $1,879 | 12.3% | 23.2% |
| Studio | $1,555 | 14.3% | 20.2% |
| 1-bed | $1,745 | 12.2% | 22.9% |
| 2-bed | $2,103 | 11.7% | 23.7% |
Figure 4: National Rent by Unit Size Trend
Surveys Confirm High-Level Rent Trends Are Impacting Individuals
The sustained growth in nationwide rents is not just a macroeconomic trend that we track to measure the rental market at large, it is acutely felt by renters. In a July survey of over 1,300 renters conducted by Realtor.com’s Avail, 60% of respondents say that the increasing cost of rent & other housing expenses are causing financial strain for their household, more than report the same for food and groceries (58%) or transportation expenses (50%). 57% report that their rent has increased since moving into their current residence, showing that the rent increases we see on the market for available listings have made their way into lease renewals as well. The alternatives for renters are slim, though, as 81% of them who are considering buying a home say that rising interest rates and inflation have impacted their plans to make a purchase. As we showed last month, even though renting is becoming more and more difficult, it still offers lower monthly costs than buying a starter home in most major metros.
Landlords have taken note of the changing rental landscape and 72% of the nearly 1,300 surveyed say they plan to increase rent on at least one of their properties in the next 12 months, up from 65% in January. Among those who planned to raise rents, 80% indicated that changes in rental market prices in their area influenced their decision. Increased prices are affecting them as well, as over one-third report deferring repairs on at least one unit to save cost over the past 12 months, which leaves tenants in more expensive and less maintained housing. Landlords are also playing a role in the current slowdown of home sales, as just 23% plan to buy one or more rental properties in the next 12 months (down from 38% in January) and just 8% plan to sell a rental property in the next 12 months (down from 16% in January).
Table 3: Rental Data – 50 Largest Metropolitan Areas – July 2022
| Metro | Overall Median Rent | Overall Rent YY | Studio Median Rent | Studio Rent YY | 1-br Median Rent | 1-br Rent YY | 2-br Median Rent | 2-br Rent YY |
| Atlanta-Sandy Springs-Roswell, Ga. | $1,859 | 7.5% | $1,739 | 13.7% | $1,726 | 7.9% | $2,063 | 4.5% |
| Austin-Round Rock, Texas | $1,853 | 14.6% | $1,555 | 17.8% | $1,719 | 17.9% | $2,053 | 13.0% |
| Baltimore-Columbia-Towson, Md. | $1,821 | 8.7% | $1,451 | 5.8% | $1,731 | 8.9% | $1,935 | 9.3% |
| Birmingham-Hoover, Ala. | $1,295 | 12.1% | $989 | -10.1% | $1,241 | 15.7% | $1,348 | 10.0% |
| Boston-Cambridge-Newton, Mass.-N.H. | $2,995 | 24.8% | $2,591 | 31.2% | $2,782 | 21.0% | $3,325 | 27.9% |
| Buffalo-Cheektowaga-Niagara Falls, N.Y. | $1,340 | 6.3% | $1,125 | 2.7% | $1,230 | 10.8% | $1,480 | 5.3% |
| Charlotte-Concord-Gastonia, N.C.-S.C. | $1,755 | 14.9% | $1,631 | 19.0% | $1,669 | 16.4% | $1,855 | 8.8% |
| Chicago-Naperville-Elgin, Ill.-Ind.-Wisc. | $2,045 | 20.6% | $1,750 | 46.4% | $2,000 | 22.3% | $2,249 | 18.4% |
| Cincinnati, Ohio-Ky.-Ind. | $1,513 | 10.8% | $1,205 | 10.0% | $1,450 | 11.4% | $1,660 | 5.7% |
| Cleveland-Elyria, Ohio | $1,430 | 13.9% | $1,000 | 14.3% | $1,319 | 9.9% | $1,555 | 12.7% |
| Columbus, Ohio | $1,312 | 9.3% | $1,095 | 9.6% | $1,231 | 8.6% | $1,409 | 8.4% |
| Dallas-Fort Worth-Arlington, Texas | $1,703 | 14.7% | $1,445 | 15.6% | $1,566 | 16.8% | $2,008 | 13.7% |
| Denver-Aurora-Lakewood, Colo. | $2,005 | 6.6% | $1,669 | 6.6% | $1,880 | 6.7% | $2,370 | 7.7% |
| Detroit-Warren-Dearborn, Mich. | $1,455 | 8.4% | $1,210 | 20.4% | $1,255 | 11.1% | $1,600 | 6.7% |
| Hartford-West Hartford-East Hartford, Conn. | $1,770 | 13.8% | $1,540 | 28.4% | $1,615 | 9.9% | $2,039 | 13.3% |
| Houston-The Woodlands-Sugar Land, Texas | $1,450 | 8.2% | $1,335 | 2.2% | $1,335 | 8.4% | $1,625 | 6.6% |
| Indianapolis-Carmel-Anderson, Ind. | $1,325 | 11.4% | $1,081 | 12.1% | $1,235 | 13.8% | $1,464 | 9.7% |
| Jacksonville, Fla. | $1,623 | 11.9% | $1,199 | 23.0% | $1,506 | 10.0% | $1,770 | 12.1% |
| Kansas City, Mo.-Kan. | $1,360 | 11.9% | $1,030 | 3.0% | $1,270 | 14.9% | $1,570 | 13.9% |
| Las Vegas-Henderson-Paradise, Nev. | $1,631 | 8.7% | $1,250 | 13.6% | $1,500 | 8.3% | $1,735 | 7.3% |
| Los Angeles-Long Beach-Anaheim, Calif. | $3,047 | 12.6% | $2,325 | 16.3% | $2,785 | 12.7% | $3,512 | 11.2% |
| Louisville/Jefferson County, Ky.-Ind. | $1,250 | 13.1% | $1,095 | 20.3% | $1,165 | 9.4% | $1,429 | 13.0% |
| Memphis, Tenn.-Miss.-Ark. | $1,409 | 8.5% | $1,149 | 4.5% | $1,369 | 9.6% | $1,549 | 8.8% |
| Miami-Fort Lauderdale-West Palm Beach, Fla. | $2,840 | 26.2% | $2,479 | 33.0% | $2,500 | 25.0% | $3,200 | 28.0% |
| Milwaukee-Waukesha-West Allis, Wisc. | $1,588 | 9.5% | $1,245 | 8.3% | $1,490 | 10.4% | $1,814 | 8.6% |
| Minneapolis-St. Paul-Bloomington, Minn.-Wisc. | $1,600 | 3.3% | $1,249 | 2.1% | $1,506 | 3.2% | $1,934 | 0.5% |
| Nashville-Davidson–Murfreesboro–Franklin, Tenn. | $1,777 | 14.6% | $1,650 | 1.2% | $1,673 | 14.6% | $1,915 | 18.0% |
| New Orleans-Metairie, La. | N/A* | |||||||
| New York-Newark-Jersey City, N.Y.-N.J.-Penn. | $3,010 | 25.4% | $2,750 | 31.0% | $2,710 | 23.2% | $3,400 | 25.0% |
| Oklahoma City, Okla. | $1,050 | 11.8% | $964 | 30.3% | $945 | 9.2% | $1,189 | 17.8% |
| Orlando-Kissimmee-Sanford, Fla. | $1,981 | 20.4% | $1,746 | 18.3% | $1,817 | 20.7% | $2,248 | 19.1% |
| Philadelphia-Camden-Wilmington, Penn.-N.J.-Del.-M.D. | $1,835 | 8.3% | $1,550 | 11.9% | $1,770 | 8.9% | $2,000 | 5.3% |
| Phoenix-Mesa-Scottsdale, Ariz. | $1,755 | 4.8% | $1,415 | 8.3% | $1,609 | 4.8% | $1,925 | 2.6% |
| Pittsburgh, Penn. | $1,600 | 11.4% | $1,315 | 7.8% | $1,625 | 14.0% | $1,750 | 7.7% |
| Portland-Vancouver-Hillsboro, Ore.-Wash. | $1,861 | 9.6% | $1,490 | 5.5% | $1,799 | 8.4% | $2,192 | 9.6% |
| Providence-Warwick, R.I.-Mass. | N/A* | |||||||
| Raleigh, N.C. | $1,694 | 13.3% | $1,562 | 15.8% | $1,575 | 15.0% | $1,893 | 11.2% |
| Richmond, Va. | $1,453 | 11.4% | $1,200 | 11.6% | $1,326 | 11.7% | $1,575 | 11.5% |
| Riverside-San Bernardino-Ontario, Calif. | $2,600 | 4.2% | $1,800 | 25.1% | $2,239 | 6.5% | $2,820 | 3.4% |
| Rochester, N.Y. | $1,360 | 8.4% | $995 | 12.4% | $1,295 | 11.6% | $1,465 | 10.6% |
| Sacramento–Roseville–Arden-Arcade, Calif. | $2,083 | 3.4% | $1,735 | -6.2% | $1,950 | 0.9% | $2,273 | 3.8% |
| San Antonio-New Braunfels, Texas | $1,418 | 13.4% | $1,290 | 10.8% | $1,304 | 15.7% | $1,619 | 12.0% |
| San Diego-Carlsbad, Calif. | $3,195 | 16.2% | $2,472 | 14.9% | $2,955 | 17.0% | $3,566 | 14.8% |
| San Francisco-Oakland-Hayward, Calif. | $3,200 | 11.9% | $2,560 | 13.8% | $2,952 | 11.4% | $3,704 | 11.4% |
| San Jose-Sunnyvale-Santa Clara, Calif. | $3,350 | 16.2% | $2,655 | 14.9% | $3,100 | 14.8% | $3,750 | 15.9% |
| Seattle-Tacoma-Bellevue, Wash. | $2,310 | 11.9% | $1,915 | 14.9% | $2,293 | 9.6% | $2,704 | 10.8% |
| St. Louis, Mo.-Ill. | $1,395 | 9.0% | $1,020 | 6.3% | $1,300 | 6.8% | $1,497 | 6.9% |
| Tampa-St. Petersburg-Clearwater, Fla. | $2,102 | 9.3% | $2,025 | 19.2% | $1,880 | 8.0% | $2,300 | 6.8% |
| Virginia Beach-Norfolk-Newport News, Va.-N.C. | $1,585 | 7.2% | $1,400 | 11.1% | $1,483 | 7.2% | $1,744 | 7.1% |
| Washington-Arlington-Alexandria, DC-Va.-Md.-W. Va. | $2,208 | 10.4% | $1,774 | 8.8% | $2,090 | 10.0% | $2,581 | 8.0% |
*New Orleans and Providence, R.I. excluded while rental data is under review.
Methodology
Rental data as of July for units advertised as for-rent on Realtor.com®. Rental units include apartment communities as well as private rentals (condos, townhomes, single-family homes). All units were studio, 1-bedroom, or 2-bedroom units. We use communities that reliably report data each month within the top 50 largest metropolitan areas. National rents were calculated by averaging the medians of the 50 largest metropolitan areas.Realtor.com® began publishing regular monthly rental trends reports in October 2020 with data history stretching back to March 2019.
Suburban and Urban distinctions were made by classifying zip codes within each metro by percentiles of population density within the metro. Rental listings are assigned a classification based on their zip code and then aggregated by classification and metropolitan area for analysis.
Metro-level rental data for Providence and New Orleans has been withheld from the appendix table due to inconsistencies in sample size under the current sampling methodology. Further refining of this process is underway for future monthly reports.
Realtor.com®‘s Avail Quarterly Landlord and Renter Survey: Survey responses collected from a nationally representative sample of more than 3,100 renters and independent landlords. The survey was conducted between July 21st, 2022, and July 29th, 2022. The margin of error for landlords is ± 2.7%, and ± 2.6% for renters.
Note: With the release of its May 2022 rent report, Realtor.com® incorporated a new and improved methodology for capturing and reporting rental listing trends and metrics. The new methodology is expected to yield a cleaner and more consistent measurement of rental listings and trends at both the national and local level. The methodology has been adjusted to better represent the true cost of primary housing for renters. Most areas across the country will see minor changes with a smaller handful of areas seeing larger updates. As a result of these changes, the rental data released since May 2022 will not be directly comparable with previous releases (files downloaded before May 2022) and Realtor.com® economics blog posts. However, future data releases, including historical data, will consistently apply the new methodology.
Subscribe to our mailing list to receive monthly updates and notifications on the latest data and research.